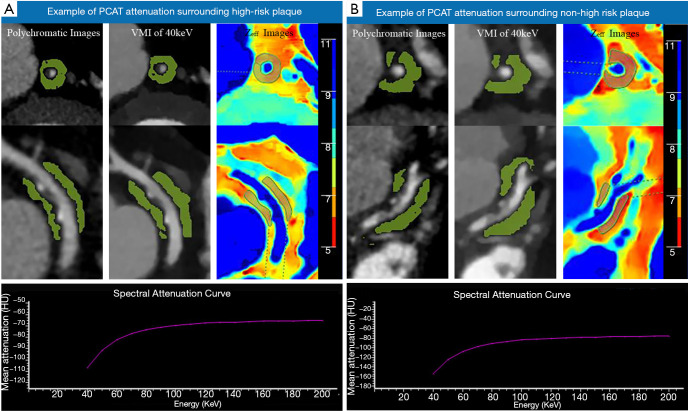
Figure 3.
Examples of PCAT attenuation surrounding high-risk plaque (A) (CTpoly = −76.8 HU, CT40 keV = −106.9 HU, λHU = −1.01, Zeff = 6.72) and non-high-risk plaque (B) (CTpoly = −87.5 HU, CT40 keV = −154.7 HU, λHU = −1.91, Zeff = 6.28). As shown in the images, the high-risk plaques showed positive remodeling, spotty calcification, and the napkin-ring sign. As shown on the images, the green region is the PCAT region—adipose tissue voxels located within a distance from the outer vessel wall equal to the diameter of the respective vessel and identified by applying attenuation threshold. The breaks in the display are those excluded voxels which may be the adjacent small vessels or myocardium. In addition, in the effective atomic number images, each color represents 1 atomic number as shown on the images. CTpoly, PCAT attenuation assessed by polychromatic imaging; CT40 keV, PCAT attenuation assessed by virtual mono-energetic imaging (40 keV); PCAT, pericoronary adipose tissue; Zeff, effective atomic number; λHU, the slope of the spectral attenuation curve.

