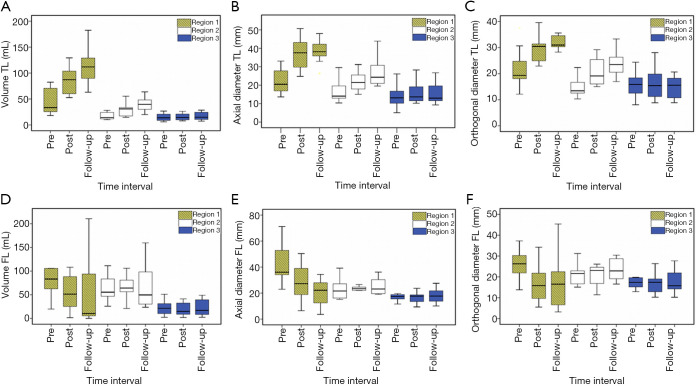
Figure 3.
Boxplots showing the differences in TL volume (A), TL maximal axial diameter (B), TL maximal orthogonal diameter (C), FL volume (D), FL maximal axial diameter (E) and FL maximal orthogonal diameter (F) changes between pre-treatment, post-treatment and follow-up at Regions 1, 2 and 3. FL, false lumen; TL, true lumen.

