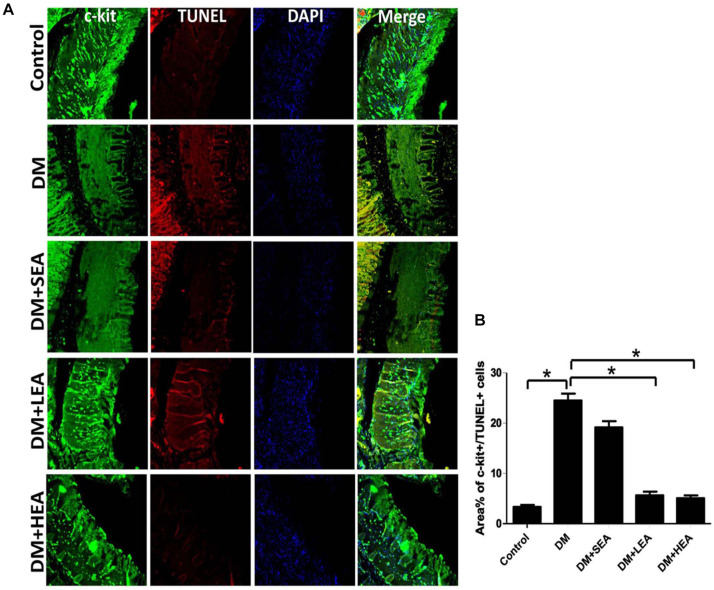
FIGURE 3.
Confocal micrographs of apoptotic interstitial cells of Cajal (ICC) labeled with c-kit (green), TUNEL (red), and DAPI (blue). (A) In the control group, many c-kit + cells were observed in the gastric wall, but a few of c-kit + /TUNEL + cells were found. The number of ICC was decreased in the DM and diabetic and sham EA (DM + SEA) group. A few apoptotic ICC was seen in the DM + LEA and DM + HEA groups. Scale bars = 20 mm. (B) Quantification of c-kit + /TUNEL + cells in the stomach of each group. One-way ANOVA was used to analyze the data, and the Dunnett T3 post hoc test was used for the analyses. *P < 0.05 compared with the DM group.

