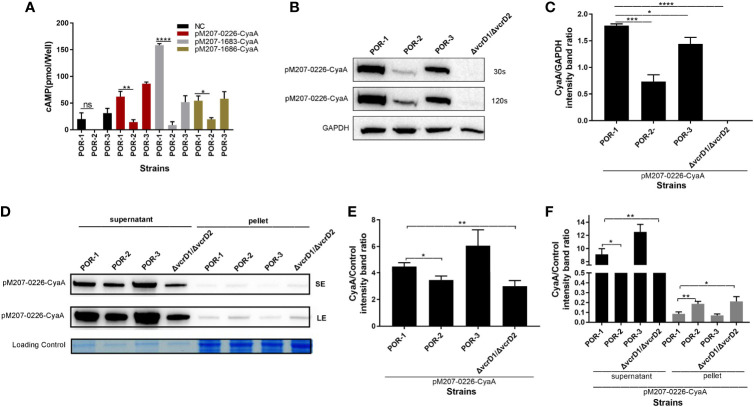
Figure 5.
VPA0226 is secreted by T3SS1. Intracellular cAMP levels were quantified after infection with V. parahaemolyticus POR-1, POR-2, and POR-3 strains, which harbored pMMB207-vpa0226-CyaA, pMMB207-vp1683-CyaA, and pMMB207-vp1686-CyaA, respectively (A). Intracellular translocated amounts of CyaA-fused protein were also examined after infection with V. parahaemolyticus POR-1, POR-2, and POR-3 strains harboring the pMMB207-vpa0226-CyaA expression vector. GAPDH served as internal reference. “+” or “-” refers to a strain harboring pMMB207-vpa0226-CyaA expression vector (+) or not (-) (B). Densitometry analysis of B was performed for relative quantification (C). Secretion of VPA0226 (supernatant) from POR-1, POR-2, POR-3 and ΔvcrD1/vcrD2 strains harboring the pMMB207-vpa0226-CyaA vector were detected by immunoblotting with anti-CyaA antibody (D). Loading control served as total bacterial lysate or total secretion media, LE, Long exposure; SE, Short exposure. Densitometry analysis of SE and LE were respectively performed for relative quantification, as shown in (E, F) E (the supernatant of SE): the CyaA/Control (intensity band ratio) of POR-1, POR-2, POR-3 and ΔvcrD1/vcrD2 is 4.47 (60725/13565), 3.51 (43948/12494), 6.00 (77525/12919), and 2.98 (30288/10145), respectively. F (the supernatant of LE): the CyaA/Control (intensity band ratio) of POR-1, POR-2, POR-3 and ΔvcrD1/vcrD2 is 9.11 (123677/13565), 7.39 (92309/12494), 12.48 (161263/12919), and 6.54 (66395/10145), respectively. F (the pellet of LE): the CyaA/Control (intensity band ratio) of POR-1, POR-2, POR-3 and ΔvcrD1/vcrD2 is 0.09 (2362/27281), 0.18 (6382/34193), 0.07 (1788/25424) and 0.21 (5996/28786), respectively. ****P < 0.0001, ***P < 0.001, **P < 0.01, and *P < 0.05.

