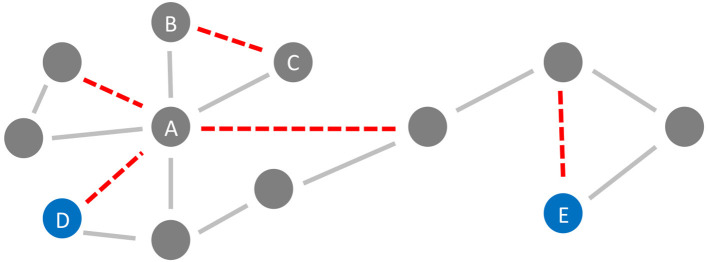
Figure 6.
Neurodegeneration in Alzheimer's Disease (AD) from a network perspective. In this schematic example network, the red links (edges) are being weakened and progressively disconnected by AD. Preferentially, edges attached to nodes with high degree (hubs) are being targeted (here node A) (Stam et al., 2009; Lo et al., 2010; Yan et al., 2018). Besides, lower clustering in AD has repeatedly been observed (Brier et al., 2014b; Minati et al., 2014; Pereira et al., 2016; Dai et al., 2019), i.e., links involved in triangles are broken off (here, e.g., the link between nodes B and C forming the triangle A-B-C). These two “attacks” of AD on the network lead not only to a lower clustering coefficient but also evoke a lower efficiency, defined here as the inverse of the global path length. This lower efficiency is demonstrated in the example network by the shortest path length between the blue nodes D and E before and after the deletion of the red links (before: 4 links, after: 6 links).

