-
A
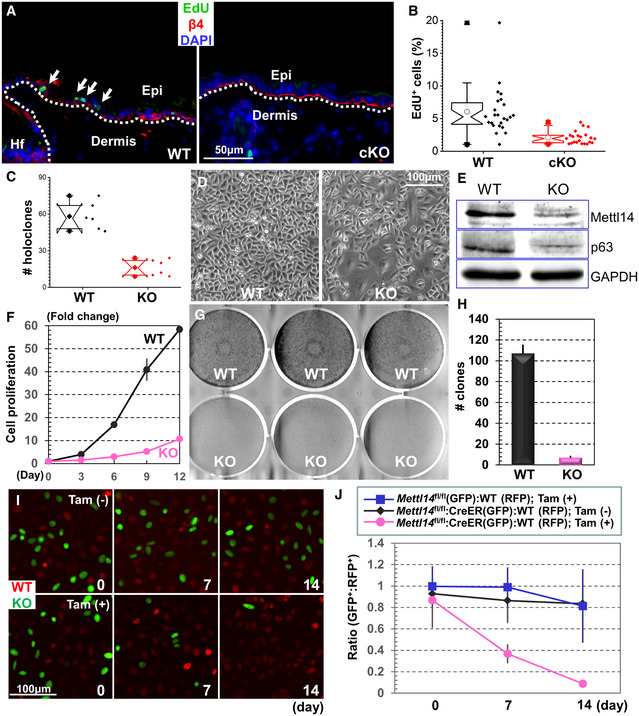
EdU staining of WT or Mettl14 cKO skin after pulse‐chase labeling. Skin samples were counterstained with antibody against β4‐integrin. Note reduced EdU label‐retaining cells in cKO skin epidermis. Arrows indicate Edu‐positive cells.
-
B
Label‐retaining cells in WT or Mettl14 cKO skin were quantified and shown as box plots. The plot indicates the mean (open circle within the box), 25th percentile (bottom line of the box), median (middle line of the box), 75th percentile (top line of the box), 5th and 95th percentile (whiskers), 1st and 99th percentile (solid triangles), and minimum and maximum measurements (solid squares). n = 6 (biological repeats), P < 0.05 (Student’s t‐test). n = 19, P < 0.01 (Student’s t‐test).
-
C
Number of holoclones derived from WT and Mettl14 cKO skin was quantified and shown as box and whisker plots. The plot indicates the mean (solid diamond within the box), 25th percentile (bottom line of the box), median (middle line of the box), 75th percentile (top line of the box), 5th and 95th percentile (whiskers), 1st and 99th percentile (solid triangles), and minimum and maximum measurements (solid squares). n = 6 (biological repeats), P < 0.05 (Student’s t‐test). n = 24, P < 0.01 (Student’s t‐test).
-
D
Morphology of primary keratinocytes isolated from WT or Mettl14 cKO skin.
-
E
Expression of Mettl14 and p63 in WT and KO cells was determined by immunoblots with respective antibodies. Immunoblot for GAPDH was used as loading control.
-
F
Proliferation of WT and Mettl14 null cells in vitro was quantified and shown as dot plots. n = 3, P < 0.01 (Student’s t‐test) for Days 6, 9, and 12, and P < 0.05 (Student’s t‐test) for Day 3. Error bar represents s.d.
-
G, H
CFE (colony formation efficiency) of WT and Mettl14 null cells was determined in vitro. Results were quantified and shown as bar graph (H). n = 19, P < 0.01 (Student’s t‐test). Error bar represents s.d.
-
I
Fluorescence microscopy demonstrates different survival capability of WT and Mettl14 inducible KO cells with or without Tamoxifen (TAM) treatment.
-
J
Ratio of WT and Mettl14‐inducible KO cells in the co‐culture model was quantified and shown as dot plots. n = 8, P < 0.01 (Student’s t‐test) for KO cells with TAM treatment compared with WT cells or KO cells without TAM stimulation at both Days 7 and 14. Error bar represents s.d.

