-
A
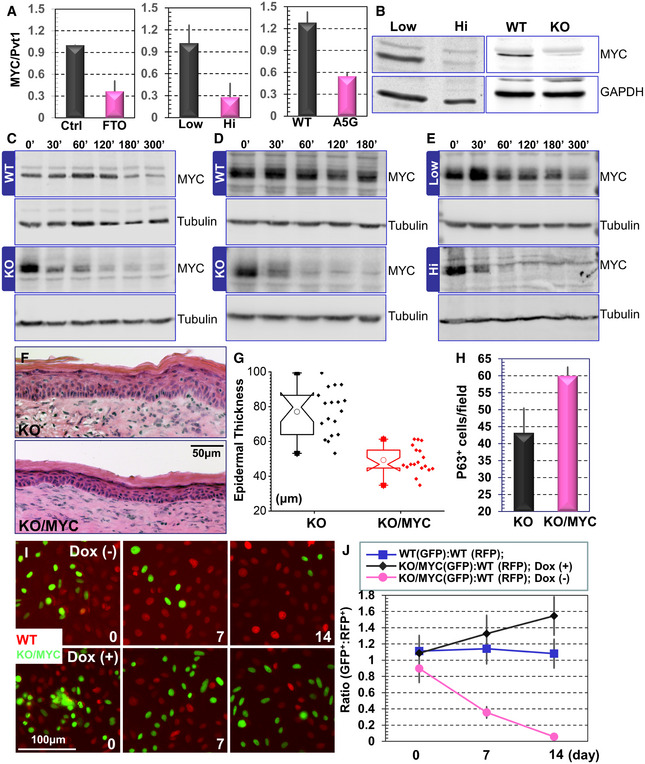
Interaction between Pvt1 and MYC was determined by immunoprecipitation followed with RT–PCR. Note significant decrease in Pvt1 and MYC interaction upon FTO treatment (left panel), calcium shift‐induced differentiation (middle panel, Hi: high calcium), and Pvt1 methylation site mutations (right panel). n = 3, P < 0.01 (Student’s t‐test). Error bar represents s.d.
-
B
Immunoblots show decreased MYC protein level in differentiated keratinocytes and Mettl14 KO cells.
-
C‐E
Undifferentiated WT and Mettl14 KO cells (C); or undifferentiated WT and Pvt1 KO cells (D); or WT cells before and after calcium shift‐induced differentiation (E) were treated with cycloheximide. Cell lysates were collected at 0, 30, 60, 90, 120, 180, and 300 min post‐treatment and subjected to immunoblotting with different antibodies as indicated.
-
F
Skin organoids derived from Mettl14 KO cells or KO cells rescued with exogenous expression of MYC were grafted to nude mice. The regenerated skin was analyzed by H/E staining.
-
G
Epidermal thickness of KO and KO skin rescued with MYC expression was quantified and presented as box and whisker plots. The plot indicates the mean (solid diamond within the box), 25th percentile (bottom line of the box), median (middle line of the box), 75th percentile (top line of the box), 5th and 95th percentile (whiskers), 1st and 99th percentile (solid triangles), and minimum and maximum measurements (solid squares). n = 6 (biological repeats), P < 0.05 (Student’s t‐test). n = 18, P < 0.01 (Student’s t‐test).
-
H
Number of p63‐positive cells in KO and KO skin rescued with MYC expression was quantified and shown as bar graph. n = 5, P < 0.01 (Student’s t‐test). Error bar represents s.d.
-
I
Fluorescence microscopy demonstrates different survival capability of WT and Mettl14 KO cells with inducible expression of MYC.
-
J
Ratio of WT and Mettl14 KO cells with inducible expression of MYC in the co‐culture model was quantified and shown as dot plots. n = 8, P < 0.01 (Student’s t‐test) for KO cells without Dox treatment (no MYC expression) compared with WT cells or KO cells with Dox stimulation (exogenous MYC expression) at both Days 7 and 14. Error bar represents s.d.

