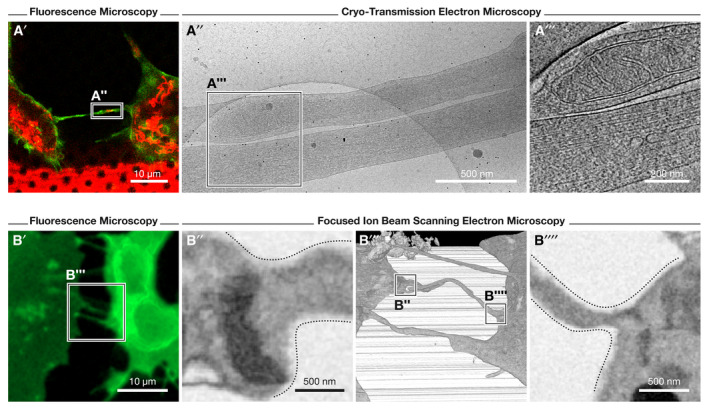
Figure 3. Observation of TNTs by various electron microscopy‐based approaches.

(A) Cryo‐correlative electron microscopy (cryo‐CLEM) and focused ion beam scanning EM (FIB‐SEM) approaches employed to study TNTs of SH‐SY5Y cells; images modified from (Sartori‐Rupp et al, 2019). (A′) Identification of TNT‐connected cells is first performed through fluorescence microscopy of WGA (green)‐ and mitochondria (red)‐labeled cells (seeded on EM finder grids). After vitrification of cells, the recorded position of TNTs acquired by fluorescence microscopy is imaged by cryo‐transmission EM (cryo‐TEM) and electron tomography (cryo‐ET) at medium‐ and high‐magnification (A″ and A‴, respectively). A mitochondrion can be observed within an iTNT in A‴. (B) Correlative, FIB‐SEM method employed to visualize TNTs using fluorescence microscopy (cells labeled with WGA, green) and FIB‐SEM to assess open‐ended contact sites (B″ and B′′′′, respectively) through high‐resolution 3D, volume imaging (B‴).
