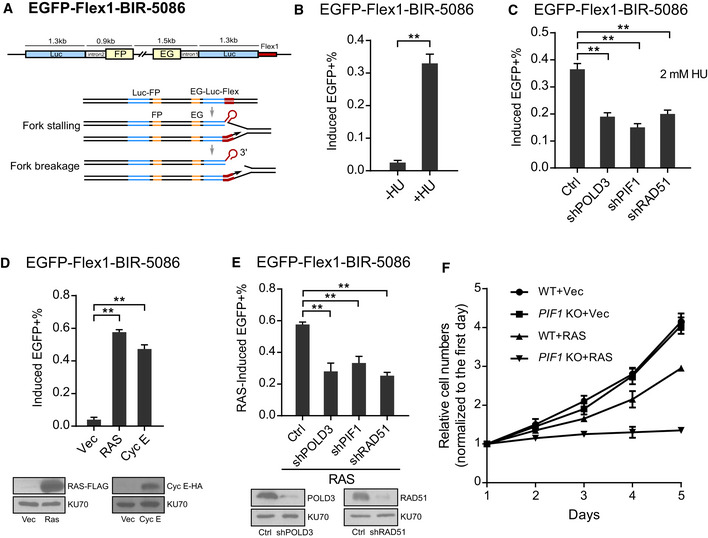
Figure 3. PIF1 is required for BIR at Flex1 upon replication and oncogenic stress.

- Schematic drawing of the EGFP‐Flex1‐BIR‐5086 reporter. Flex1: 0.3 kb Flex1(AT)34 derived from CFS FRA16D.
- U2OS (EGFP‐Flex1‐BIR‐5086) cells were treated with or without 2 mM HU for 24 h, and the percentage of EGFP‐positive cells was quantified by FACS analysis 3 days after HU removal.
- U2OS (EGFP‐Flex1‐BIR‐5086) cells expressing shRNAs for RAD51, POLD3, and PIF1 or shRNA vector (Ctrl) were treated with 2 mM HU for 24 h. The percentage of EGFP‐positive cells by HU induction was quantified by FACS analysis 3 days after HU removal.
- U2OS (EGFP‐Flex1‐BIR‐5086) cells were infected by retrovirus expressing H‐RAS‐V12‐FLAG (RAS) or Cyclin E‐HA (Cyc E), and the percentage of EGFP‐positive cells was quantified by FACS analysis 4 days after retrovirus infection (top). The expression of RAS or Cyclin E is shown by Western blot analysis (bottom).
- U2OS (EGFP‐Flex1‐BIR‐5086) cells expressing shRNAs for RAD51, POLD3, and PIF1 or shRNA vector (Ctrl) were infected by retroviruses expressing RAS, and the percentage of EGFP‐positive cells was quantified by FACS analysis 4 days after retrovirus infection (top). Expression level of RAD51 and POLD3 is shown by Western blot analysis (bottom).
- U2OS WT or PIF1‐KO cells were infected by retrovirus expressing RAS or empty vector. Cell profiling was plotted by counting cell numbers every 24 h, and normalized to the cell number on the first day.
Data information: Error bars represent the standard deviation (SD) of at least three independent experiments. Significance of the differences was assayed by two‐tailed non‐paired parameters were applied in Student's t‐test. The P value is indicated as **P < 0.01.
Source data are available online for this figure.
