
Figure 4. BIR is used at replication‐associated DSBs even for STGC.
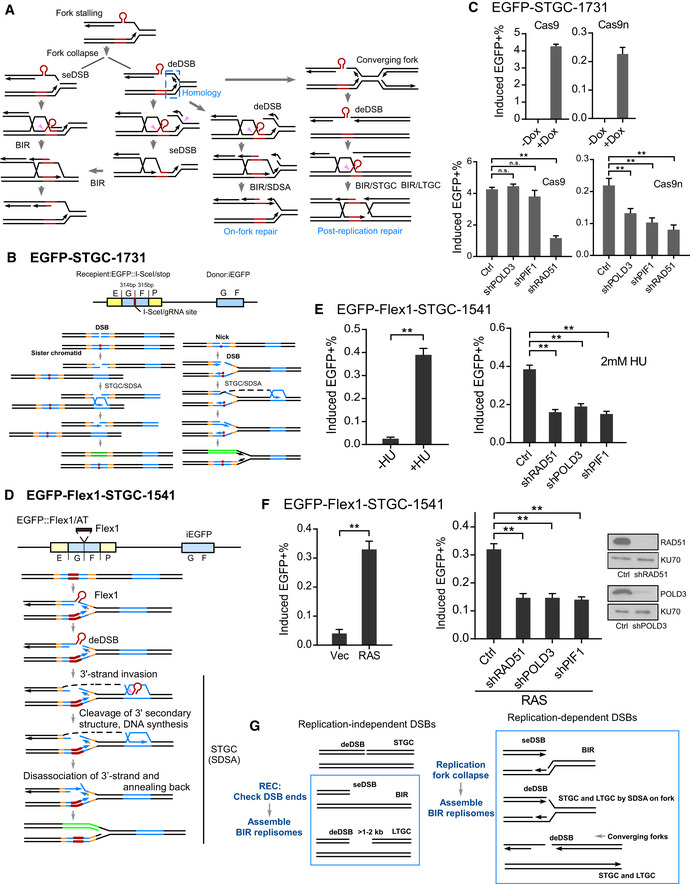
- Proposed models for repair of DSBs generated at broken replication forks (see text for details). seDSB: single‐ended DSB; deDSB: double‐ended DSB. Pink arrows: endonucleases to remove Flex1 or other secondary structures at DSB ends or DNA tails at the fork junctions.
- Schematic drawing of the EGFP‐STGC‐1731 reporter and proposed pathways to repair DSBs generated by endonuclease cleavage (I‐SceI or Cas9, left) or converted from nicks (Cas9n, right).
- U2OS (EGFP‐STGC‐1731) cell lines carrying Dox‐inducible Cas9/sgRNA‐1731 (Dox‐Cas9) or Cas9n/sgRNA (Dox‐Cas9n) were incubated with or without Dox (5 µg/ml), and the percentage of EGFP‐positive cells was quantified by FACS analysis 2 days later (top). U2OS (EGFP‐STGC‐1731, Dox‐Cas9 or Dox‐Cas9n) cells expressing shRNAs for RAD51, POLD3, and PIF1 or shRNA control (Ctrl) were incubated with Dox (5 µg/ml), and the percentage of EGFP‐positive cells was quantified by FACS analysis after 2 days (bottom).
- Schematic drawing of the EGFP‐Flex1‐STGC‐1541 reporter and the proposed mechanism to repair DSBs at Flex1 generated upon fork breakage by SDSA which involves two DSB ends.
- U2OS (EGFP‐Flex1‐STGC‐1541) cells were treated with or without 2 mM HU for 24 h, and the percentage of EGFP‐positive cells by HU induction was quantified by FACS analysis 4 days after removal of HU (left). U2OS (EGFP‐Flex1‐STGC‐1541) cells expressing shRNAs for RAD51, POLD3, and PIF1 or shRNA vector (Ctrl) were treated with 2 mM HU for 24 h, and the percentage of EGFP‐positive cells was quantified by FACS analysis 4 days later (right).
- U2OS (EGFP‐Flex1‐STGC‐1541) cells were infected by retroviruses expressing RAS or empty vector, and the percentage of EGFP‐positive cells was assayed by FACS 5 days following infection (left). U2OS (EGFP‐Flex1‐STGC‐1541) cells expressing shRNAs for RAD51, POLD3, and PIF1 shRNAs or shRNA vector were infected by retroviruses expressing RAS, and the percentage of EGFP‐positive cells was assayed by FACS 5 days after infection (middle). Expression level of RAD51 and POLD3 is shown by Western blot analysis (right).
- Proposed models for activating BIR at replication‐dependent and replication‐independent DSBs (see text for details).
Data information: Error bars represent the standard deviation (SD) of at least three independent experiments. Significance of the differences was assayed by two‐tailed non‐paired parameters were applied in Student's t‐test. The P value is indicated as **P < 0.01 and n.s. (not significant) P > 0.05.
Source data are available online for this figure.