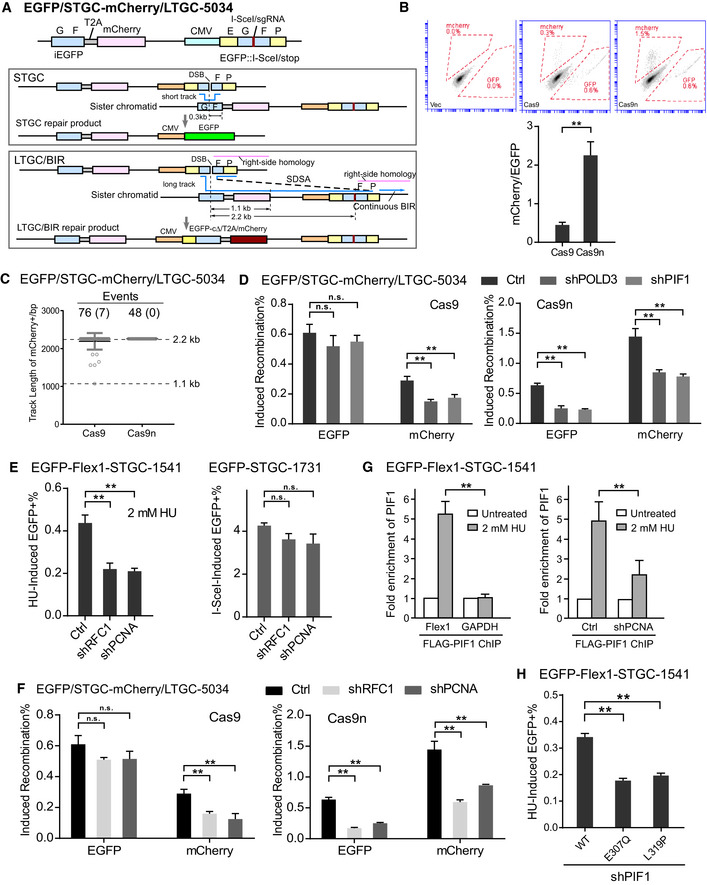
Figure 5. BIR with long repair track is promoted at DSBs on broken forks, and PCNA and RFC1 are required for activating BIR.

- Schematic drawing of EGFP/STGC‐mCherry/LTGC‐5034 reporter and the repair products generated by the STGC or LTGC/BIR mechanisms.
- U2OS (EGFP/STGC‐mCherry/LTGC‐5034) with Dox‐inducible Cas9/sgRNA‐1731 (Cas9) or Cas9n/sgRNA‐1731 (Cas9n) or empty vector (Vec) were assayed for recombination by FACS analysis 2 days after adding Dox (5 µg/ml). Representative FACS data (top), and the ratios of mCherry to EGFP in the indicated cell lines after Dox induction were shown (bottom).
- Track length of single mCherry‐positive clones derived from U2OS (EGFP/STGC‐mCherry/LTGC‐5034) cells after Cas9/sgRNA‐1731 or Cas9n/sgRNA‐1731 cleavage was analyzed by sequencing PCR products from genomic DNA at repair junctions. The numbers of the total events analyzed after Cas9 and Cas9n cleavage are shown on the top with the numbers of events using BIR‐EJ indicated in brackets. Group means are shown. Error bars represent ± SD. Dashed lines (2.2 and 1.1 kb) indicate the upper and lower limits of track length that can be scored by this reporter.
- U2OS (EGFP/STGC‐mCherry/LTGC‐5034, Dox‐Cas9 [left] or Dox‐Cas9n [right]) cells expressing shRNAs for POLD3 and PIF1 or shRNA vector (Ctrl) were incubated with Dox (5 µg/ml). The percentage of EGFP‐ or mCherry‐positive cells after induction was quantified by FACS analysis 2 days later to determine the percentage of EGFP‐ or mCherry‐positive cells.
- U2OS (EGFP‐Flex1‐STGC‐1541) cells expressing shRNAs for RFC1 and PCNA or vector (Ctrl) were treated with 2 mM HU for 24 h. The percentage of EGFP‐positive cells after HU treatment was quantified by FACS analysis 3 days after HU removal (left). U2OS (EGFP‐STGC‐1731) cells expressing shRNAs for RFC1 and PCNA or vector (Ctrl) were infected by lentivirus expressing I‐SceI. The percentage of EGFP‐positive cells by I‐SceI induction was quantified by FACS analysis 4 days later (right).
- U2OS (EGFP/STGC‐mCherry/LTGC‐5034, Dox‐Cas9 [left] or Dox‐Cas9n [right]) cells expressing shRNAs for RFC1 and PCNA or vector (Ctrl) were incubated with Dox (5 µg/ml). The percentage of EGFP‐ or mCherry‐positive cells after induction was quantified by FACS analysis 2 days later.
- FLAG‐PIF1 was stably expressed in U2OS (EGFP‐Flex1‐STGC‐1541) cells by lentiviral infection. Enrichment of FLAG‐PIF1 at Flex1 site or GAPDH site with or without HU (2 mM, 10 h) treatment was calculated by anti‐FLAG ChIP (left). When PCNA was depleted by shRNA using vector as a control (Ctrl), enrichment of FLAG‐PIF1 at Flex1 site was calculated by anti‐FLAG ChIP (right). ChIP value in cells without HU treatment is set up as 1 for normalization.
- U2OS (EGFP‐Flex1‐STGC‐1541) cells expressing FLAG‐PIF1 WT or mutants with endogenous PIF1 depleted by shRNA were treated with 2 mM HU for 24 h. The percentage of EGFP‐positive cells after HU treatment was quantified by FACS analysis 3 days after HU removal.
Data information: Error bars represent the standard deviation (SD) of at least three independent experiments. Significance of the differences was assayed by two‐tailed non‐paired parameters were applied in Student's t‐test. The P value is indicated as **P < 0.01 and n.s. (not significant) P > 0.05.
