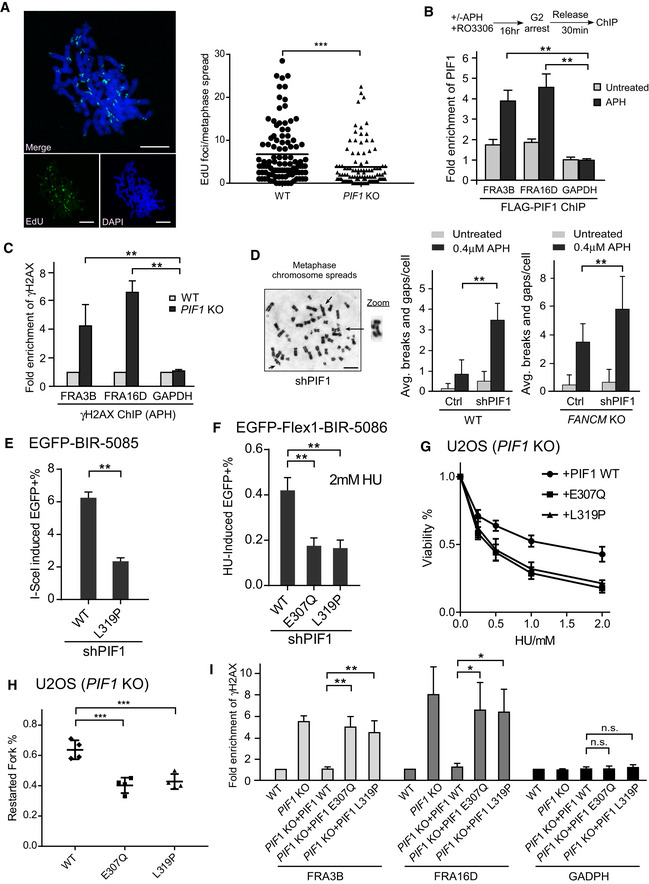
Figure 7. PIF1 is recruited to CFSs and important for preventing chromosomal breakage.

- MiDAS analysis was performed in U2OS WT and PIF1‐KO cells. Cells were treated with APH (0.4 µM) and RO‐3306 (7 µM), and then released into fresh medium containing EdU (20 µM) and Colcemid (0.1 µg/ml) as described in Materials and Methods. The image of EdU incorporation on metaphase chromosomes is shown (left) and EdU foci formed on each metaphase spread were quantified (right). ~100 metaphase spreads were analyzed in each sample. Scale bars, 10 μm.
- U2OS (HR‐Flex1‐STGC‐1541) cells expressing FLAG‐PIF1 or vector were treated with or without APH (0.4 μM, 22 h) in the presence of RO3306 (7 μM), and anti‐FLAG ChIP was performed 30 min after release from drug treatment and analyzed by qPCR. Enrichment of FLAG‐PIF1 at FRA3B, FRA16D, and GAPDH loci was calculated using ChIP value in cells expressing vector as 1 for normalization.
- Anti‐γH2AX ChIP analysis at FRA3B, FRA16D, and GAPDH genomic loci was performed in U2OS WT and PIF1‐KO cells before and after APH treatment (0.4 μM, 24 h). Enrichment of γH2AX at FRA3B, FRA16D, and GAPDH loci in WT and PIF1 KO cells was calculated using ChIP value in WT cells as 1 for normalization.
- Metaphase spread of HCT116 WT and FANCM‐KO cells was performed with or without expressing PIF1 shRNA or shRNA vector (Ctrl) before and after APH treatment (0.4 μM, 24 h). Representative images of metaphase spread are shown (left), and overall chromosome breaks and gaps per cell are quantified (right). Scale bars, 5 μm.
- U2OS (EGFP‐BIR‐5085) cells expressing PIF1 WT or L319P mutant with endogenous PIF1 silenced by shRNA were infected by lentiviruses to express I‐SceI. The percentage of EGFP‐positive cells was quantified by FACS analysis 5 days after I‐SceI infection.
- U2OS (EGFP‐Flex1‐BIR‐5086) cells expressing PIF1 WT or E307Q, L319P mutants with endogenous PIF1 silenced by shRNA were treated with 2 mM HU for 24 h. The percentage of EGFP‐positive cells by HU treatment was quantified by FACS analysis 3 days after HU removal.
- U2OS PIF1‐KO cells expressing PIF1 WT or E307Q, L319P mutants were treated with the indicated concentrations of HU for 72 h, and cell viability assays were performed.
- U2OS PIF1‐KO cells expressing PIF1 WT or E307Q, L319P mutants were labeled with CldU for 30 min, followed by 2 mM HU treatment for 2 h and IdU labeling for 30 min, and processed for DNA fiber analysis. The percentage of replication restarted DNA fibers is calculated.
- Anti‐γH2AX ChIP analysis at FRA3B, FRA16D, and GAPDH genomic loci was performed in U2OS WT and PIF1‐KO cells, or PIF1‐KO cells expressing PIF1‐WT, and E307Q and L319P mutants before and after APH treatment (0.4 μM, 24 h). Enrichment of γH2AX at FRA3B, FRA16D, and GAPDH loci was calculated using ChIP value in WT cells as 1 for normalization.
Data information: Error bars represent the standard deviation (SD) of at least three independent experiments. Significance of the differences was assayed by two‐tailed non‐paired parameters were applied in Student's t‐test. The P value is indicated as *P < 0.05, **P < 0.01, ***P < 0.001 and n.s. (not significant) P > 0.05.
Source data are available online for this figure.
