
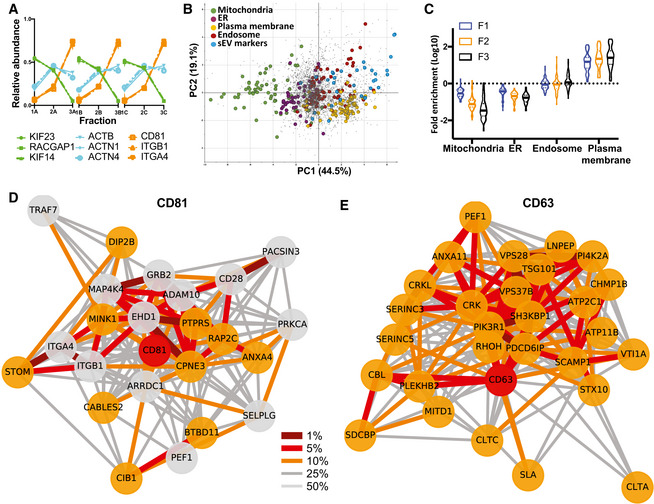
Figure 2. Unbiased proteomic profiling analysis of EV subtypes released by Jurkat cells.
-
AProteomic profiles of different proteins, showing the relative abundance distribution across the 3 × 3 subfractions obtained from Jurkat cells. Proteins with very similar profiles (represented by the same colours) are likely part of the same EV subtypes. Each profile consists of three independent data triplets (F1‐F2‐F3A, F1‐F2‐F3B and F1‐F2‐F3C).
-
BAbundance profiles of over 3,000 proteins in EVs recovered after 10K (F1), 30K (F2) and 100K (F3) centrifugations (see Appendix Fig S1), from Jurkat cells were subjected to principal component analysis (PCA). Each scatter point represents one protein; proximity indicates similar profiles and hence similar distributions across EVs. The PCA scores plot was annotated with known marker proteins of intracellular organelles, and with markers identified previously (Kowal et al, 2016) as specific for CD9‐ or CD63‐ or CD81‐bearing sEVs in human dendritic cells (Appendix Table S1), as indicated in the legend. Non‐marker proteins are shown as grey dots. EVs of different subcellular origin are clearly separated by the profiling analysis. PC1 and PC2 account for 44.5 and 19.1% of the variability in the data, respectively.
-
CViolin plots showing enrichment of the protein markers of intracellular organelles across the F1‐F2‐F3 subfractions as compared to expression in the total cell proteome. Solid horizontal lines indicate medians, and dashed line indicates quartiles (n = 3). Mitochondria and ER markers are de‐enriched, and plasma membrane markers are enriched in EV fractions, with progressively pronounced effects from F1 to F3.
-
D, ENeighbourhood Network plots (top 25% quantile edges) for single queries CD63 (E, **network members, cut‐off for replicates = 3) and CD81 (D, *network members, cut‐off for replicates = 2), show several ESCRT components in the CD63 network, and ARRDC1 and integrins ITGA4/B1 in the CD81 network. A multi‐query network for these two proteins and CD3G, shown in Fig EV1, shows that all three networks are separated, indicating presence of the markers in different EV subtypes. Nodes: red = query, orange = close neighbour in all three replicates, grey = close neighbour in two out of three replicates. Edges: percentile within the local distance distribution (thicker edge and darker shade = smaller distance, i.e. closer neighbour); see Materials and Methods for details.