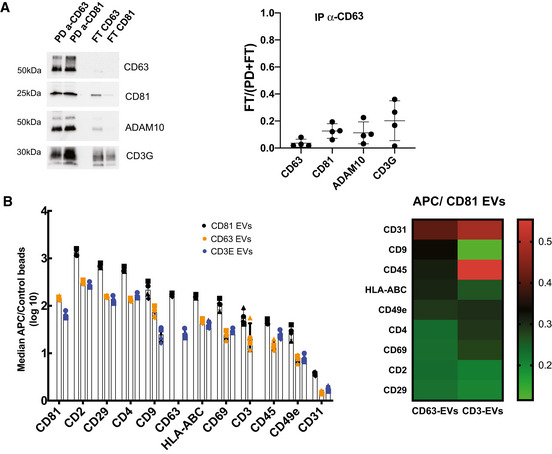
Figure EV2. Biochemical analysis of the composition of EVs released by primary CD4+ T cells.

EVs were purified by SEC from supernatant of activated CD4+T cells.
- EVs were subjected to immunoisolation with beads coupled to antibodies against CD81 or CD63. Bead‐associated (Pull‐down: PD) vesicles and those left behind (Flow‐Through: FT) were loaded on a gel for Western blot analysis with antibodies specific for CD63, CD81, ADAM10 and CD3G. A representative image and quantification (mean ± SD) of the proportion of signal in FT as compared with total (PD + FT) in samples obtained from four independent donors are shown.
- Multiplex bead‐based flow cytometry assay for detection of EV surface markers. Antibody‐coated capture beads were incubated with 2 × 10⁹ particles. Captured EVs were detected with either APC‐labelled anti‐CD81, anti‐CD63 or anti‐CD3E. Left: Median APC fluorescence values for the different bead populations are shown as a ratio to the median APC fluorescence of control beads (log10 scale). Mean ± SD for four independent experiments is shown. Right: Heat‐map representation of the median APC fluorescence values for the different bead populations detected with anti‐CD63 or anti‐CD3E antibodies relative to the values detected with anti‐CD81 (mean value of 4 independent donors).
