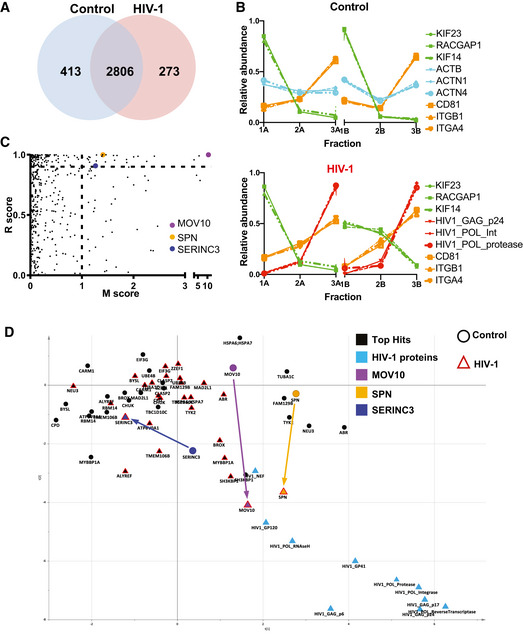
Figure 4. Identification of candidate proteins whose secretion is modified upon HIV infection.

- Number of proteins identified after analysis by mass spectrometry in the six fractions of EVs from control and HIV‐infected cells. The majority of proteins were quantified in both samples.
- Proteomic profiles of different proteins (as in Fig 2), showing the relative abundance distribution across the six subfractions. Each profile consists of two independent data triplets (F1‐F2‐F3A and F1‐F2‐F3B). Abundance profiles of the same groups of proteins as in Fig 2A showed the same clustering behaviour, although in this second dataset, the proportion of proteins recovered in the F2 was more variable. These differences, however, did not affect the results of the NNP or movement analysis.
- Unbiased identification of significant translocation events triggered by HIV‐1 infection. Each protein is scored for magnitude of translocation (M score, x‐axis) and reproducibility of translocation direction (R score, y‐axis) across the two replicates. MR plot analysis reveals significant translocations in the top right quadrant. Proteins with M > 1 and R > 0.9 are candidate hits for changing localization (estimated FDR = 8%).
- Movement of the 26 proteins identified as top hits for significant and reproducible translocation upon HIV‐1 infection (from Fig 2C and Table 2). Superimposition of two PCA plots with top hits in black and key hits (MOV10, SPN, SERINC3) highlighted with different colours. The position of each protein is shown both in non‐infected (circle) and HIV‐1 infected (red triangle) conditions. Arrows indicate movements of candidate proteins upon infection.
