Figure 1.

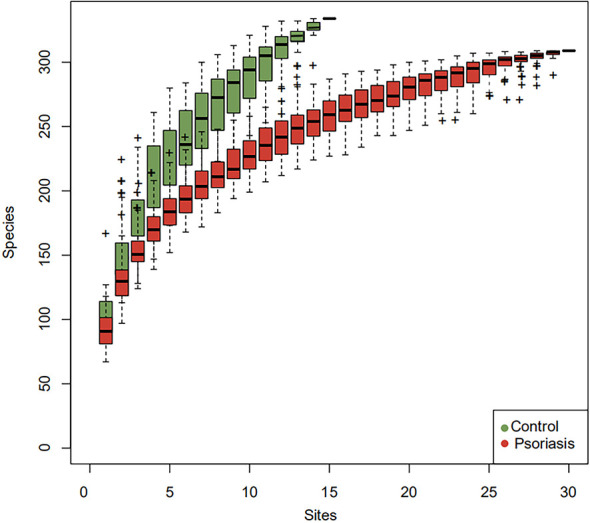
Species accumulation curves. The species accumulation curve of each group tended to plateau, indicating that sample biodiversity was adequately covered with the applied sequencing depth.

Species accumulation curves. The species accumulation curve of each group tended to plateau, indicating that sample biodiversity was adequately covered with the applied sequencing depth.