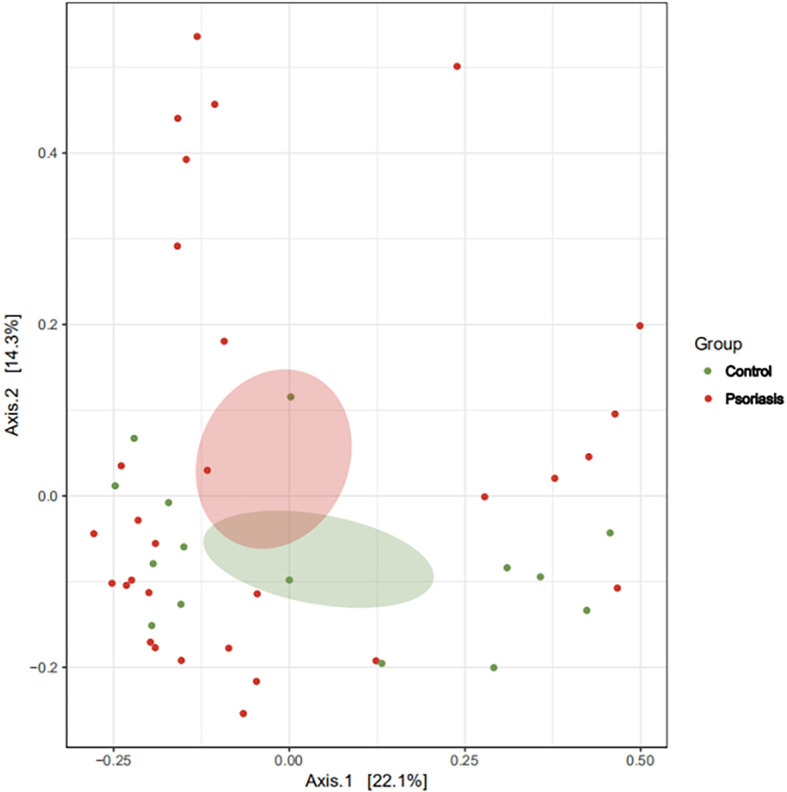
Figure 3.

β-Diversity represented as a two-dimensional PCoA showed no differential clustering between the two groups. (The red dots showed the samples from psoriasis patients, whereas the green dots showed the samples from healthy individuals. The closer the dots in one group, the more similar in gut microbiota. The gut microbiota compositions are indicated with red and green circles, respectively. The smaller the overlap of two circles, the more different in the gut microbiota compositions of two groups).
