Figure 4.

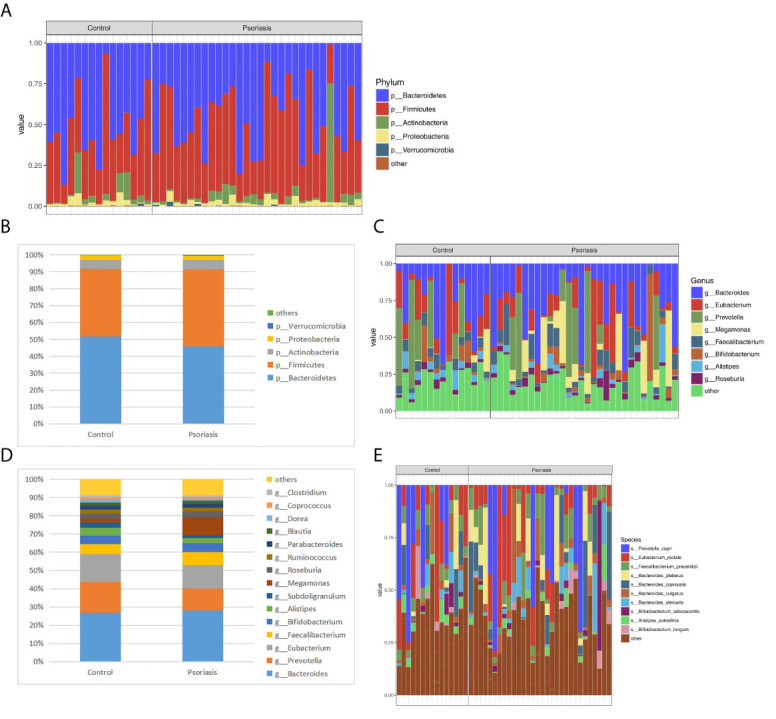
Relative abundance (%) of the intestinal microbiota determined at the phylum (A, B) genus (C, D) and species (E) levels. The columns represent individuals in the psoriasis or control group (A, C, E).

Relative abundance (%) of the intestinal microbiota determined at the phylum (A, B) genus (C, D) and species (E) levels. The columns represent individuals in the psoriasis or control group (A, C, E).