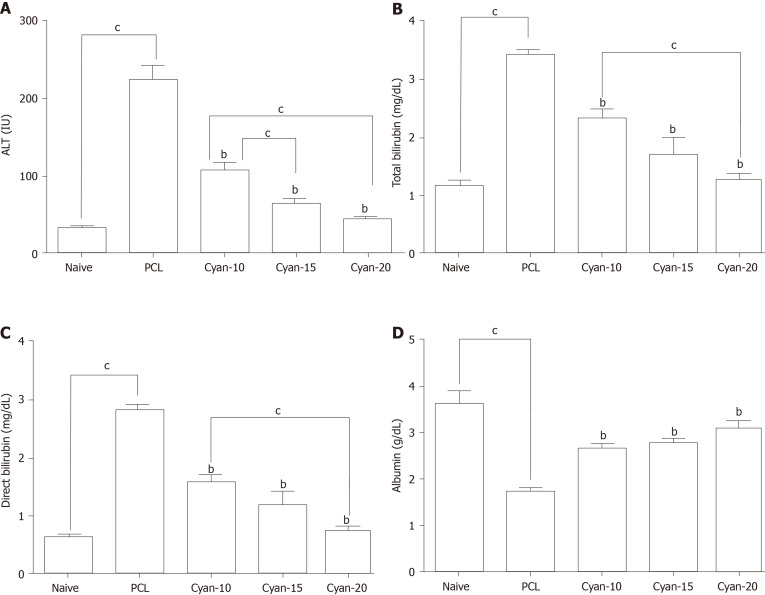
Figure 2.
Effect of cyanidin 3-glucoside at different doses (10, 15 and 20 mg/kg/d) in rats. A: Alanine aminotransferase; B: Total bilirubin; C: Direct bilirubin; D: Serum albumin. Values are mean ± SEM; number of animals = 6 rats/each group. bP < 0.05 significant differences compared to precancerous lesion group; cP < 0.05 significant differences between the 2 selected groups, One-way ANOVA followed by Tukey’s test. PCL: Precancerous lesion; Cyan: Cyanidin-3-O-glucoside; ALT: Alanine aminotransferase.

