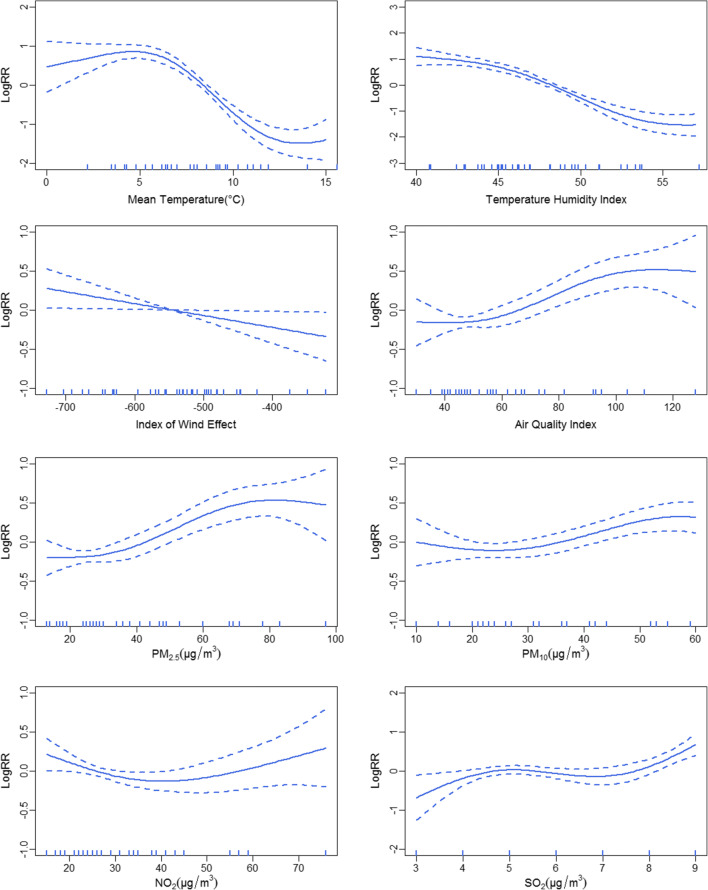
Fig. 1.
Exposure–response relationship between mean temperature (Tave), temperature humidity index (THI), index of wind effect (K), air quality index (AQI), PM2.5, PM10, NO2, and SO2 and daily confirmed coronavirus disease 2019 cases in Shanghai. The solid lines indicate the logarithm of relative risk (RR); the dotted lines show 95% confidence intervals

