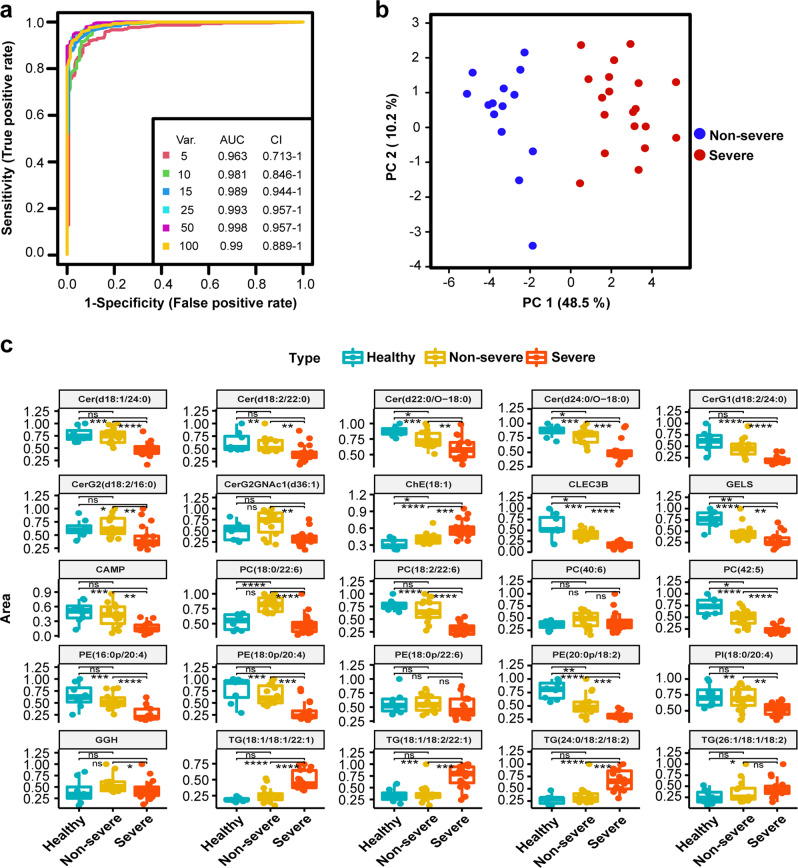
Fig. 4.
Biomarker analysis based on multi-omics signatures. a ROC curve analysis for the predictive power of combined multiple omics signatures selected by random forest for distinguishing non-severe from severe group. b Principle component analysis for the non-severe and severe groups based on selected 25 signatures. c Normalized selected signatures expression values for each sample from individual non-severe patients or severe COVID-19 patients

