Figure 5.
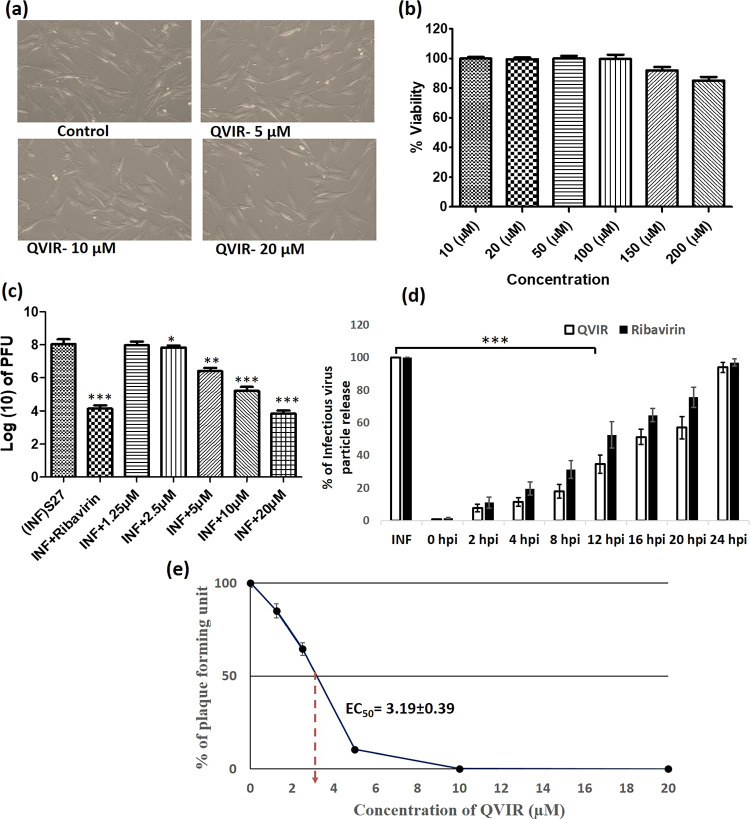
BHK-21 cells were treated at different doses of the compound QVIR (5, 10, and 20 μM) for 24 h. (a) The treated and untreated cells were analyzed in a microscope for morphological changes under a 20× objective. (b) BHK-21 cells were cultured in 96-well plates and exposed with increasing concentration (from 10 to 200 μM) of QVIR at 37 °C with 5% CO2 for 24 h. (c) Inhibition of CHIKV infection by the compound QVIR. BHK-21 cells were infected with the CHIKV prototype strain S27 (MOI, 0.01). Different doses of the drugs (1.25, 2.5, 5, 10, and 20 μM) were added to the experimental samples. Ribavirin (10 μM) was used as a positive control. The supernatants as well as cells were collected from all the experimental samples at 24 h post treatments and plaque assay was performed to determine the number of infectious particles of CHIKV. The bar diagram represents the virus titer in the log10 scale for all the experimental samples from three independent experiments. (d) BHK-21 cells were infected by CHIKV on an MOI of 0.01 following treatment with 20 μM QVIR at different time intervals (0, +2, +4, +8, +12, +16, +20, and +24 hpi). Ribavirin (10 μM) was used as a positive control. The results were assessed by plaque assay for the determination of the number of active virus particles. The bar graph represents the percentage of virus particle release, and the open bar and solid bar display the QVIR- and ribavirin-treated groups, respectively. (e) The line graph represents the percentage of plaque-forming unit and the EC50 of QVIR. The statistical analysis of the experimental data was presented as mean ± SEM from three independent experiments.

