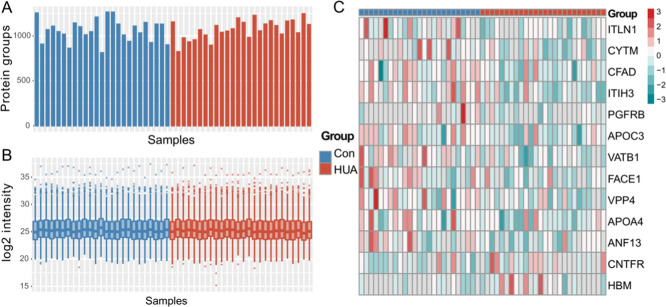
Figure 1.
General information of proteome results. HUA, hyperuricemia group; Con, control group. (A) Number of proteins identified in each sample. (B) Abundance distribution. (C) Heatmap of all differentially expressed proteins (DEPs) in HUA. The color scale indicates the z-score-transformed abundance data of each DEP. Gray indicates a missing value in quantification.

