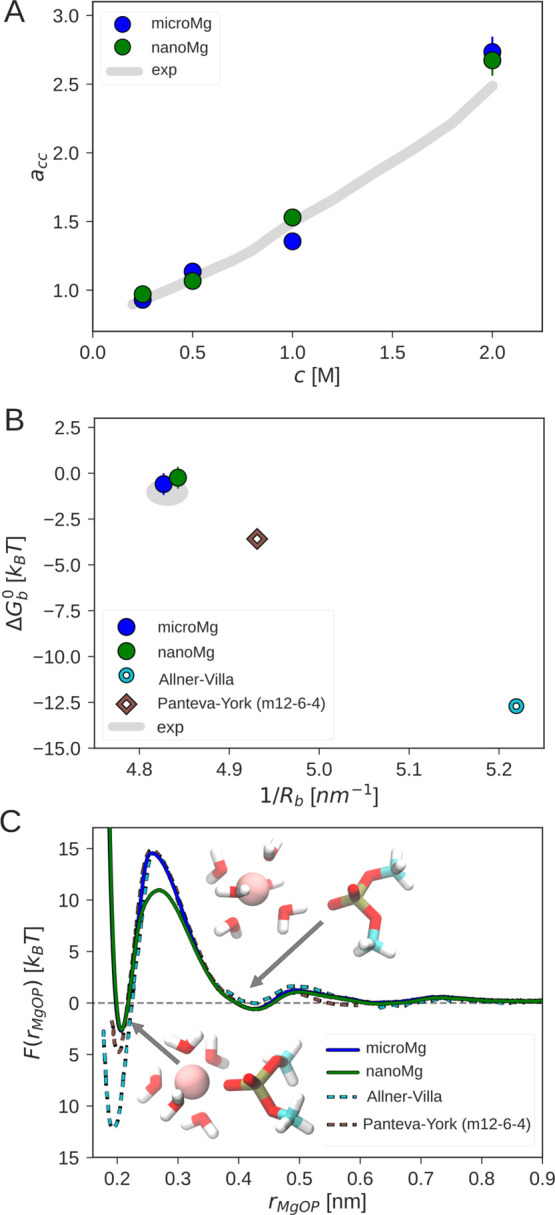
Figure 3.

Optimization of ion–ion and the ion–RNA interactions. (A) Activity derivative acc as a function of the MgCl2 salt concentration with the optimized scaling factors for microMg and nanoMg (Table 1) and from experiments.80 (B) Binding affinity ΔGb0 in correlation with inverse of the Mg2+–phosphate oxygen distance 1/Rb. The experimental values (gray) are taken from refs (62, 63). (C) Free-energy profiles as a function of the distance between Mg2+ and the phosphate oxygen of DMP, rMgOP, for different force fields. The Allnér–Villa and Panteva–York free-energy profiles were obtained from refs (16, 33) with permission. The insets show Mg2+ in the inner- and outer-sphere conformation.
