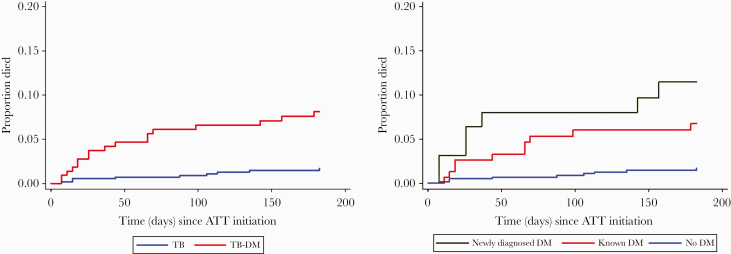
Figure 2.
A, Kaplan-Meier curve showing time to early mortality (death during the period of tuberculosis treatment) among patients with tuberculosis (TB) by diabetes mellitus (DM) status. The red line represents patients with DM, and the blue line represents patients without DM. B, Kaplan-Meier curve showing time to early mortality by newly diagnosed diabetes mellitus (DM) and known DM among patients with tuberculosis (TB). The blue line represents patients with TB without DM, the green line represents newly diagnosed DM, and the red line represents known DM.

