
FIGURE 2.
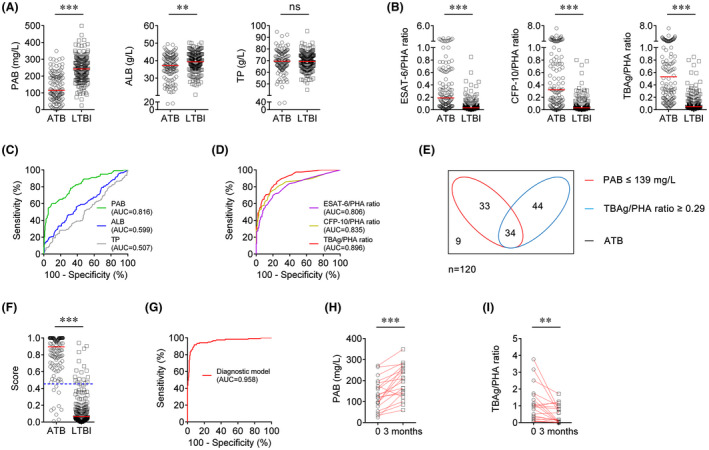
Validation of diagnostic model based on combination of PAB and TBAg/PHA ratio in Caidian cohort. A, Scatter plots showing the levels of PAB, ALB and TP in ATB patients (n = 120) and LTBI individuals (n = 189). Horizontal lines indicate the median. **P < 0.01, ***P < 0.001, ns, no significance (Mann‐Whitney U test). B, Scatter plots showing ESAT‐6/PHA ratio, CFP‐10/PHA ratio and TBAg/PHA ratio in ATB patients (n = 120) and LTBI individuals (n = 189). Horizontal lines indicate the median. ***P < 0.001 (Mann‐Whitney U test). C, ROC analysis showing the performance of PAB, ALB and TP in differentiating ATB from LTBI. D, ROC analysis showing the performance of ESAT‐6/PHA ratio, CFP‐10/PHA ratio and TBAg/PHA ratio in differentiating ATB from LTBI. E, Venn diagrams showing the overlap of PAB and TBAg/PHA ratio in ATB patients (n = 120). F, Scatter plots showing the score of the diagnostic model based on the combination of PAB and TBAg/PHA ratio in ATB patients (n = 120) and LTBI individuals (n = 189). Horizontal lines indicate the median. ***P < 0.001 (Mann‐Whitney U test). Blue dotted lines indicate the cut‐off value in distinguishing these two groups. G, ROC analysis showing the performance of the diagnostic model based on the combination of PAB and TBAg/PHA ratio in distinguishing ATB from LTBI. H, Line graphs showing the level of PAB in ATB patients (n = 20) before and after 3 months of anti‐TB treatment. ***P < 0.001 (Wilcoxon test). I, Line graphs showing TBAg/PHA ratio in ATB patients (n = 20) before and after 3 months of anti‐TB treatment. **P < 0.01 (Wilcoxon test). ALB, albumin; ATB, active tuberculosis; AUC, area under the curve; CFP‐10, culture filtrate protein 10; ESAT‐6, early secreted antigenic target 6; LTBI, latent tuberculosis infection; PAB, prealbumin; PHA, phytohaemagglutinin; ROC, receiver operating characteristic; TBAg, tuberculosis‐specific antigens; TP, total protein