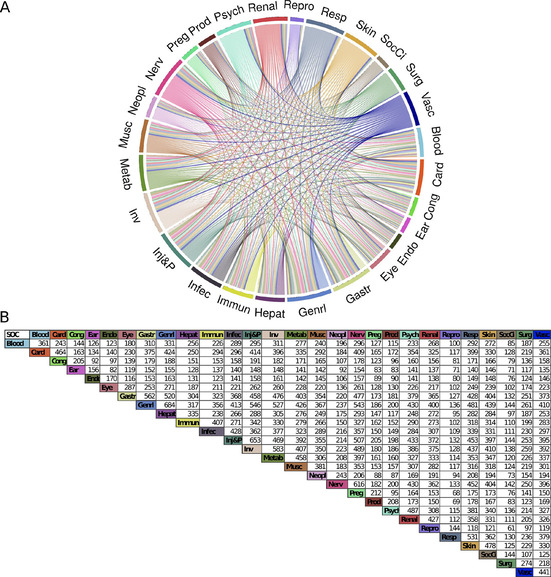
Figure 2.

A) System Organ Class (SOC) network. Each colored segment (node) corresponds to one SOC and is named according to its SOC abbreviation name (Supporting information). The segment size depicts the number of drugs associated with their corresponding SOC. Each edge represents a drug that causes an ADR linked to their corresponding SOCs. The chord diagram was developed using the R package circlize. B) SOC association counting table. Each value represents the number of drugs common to both SOCs.
