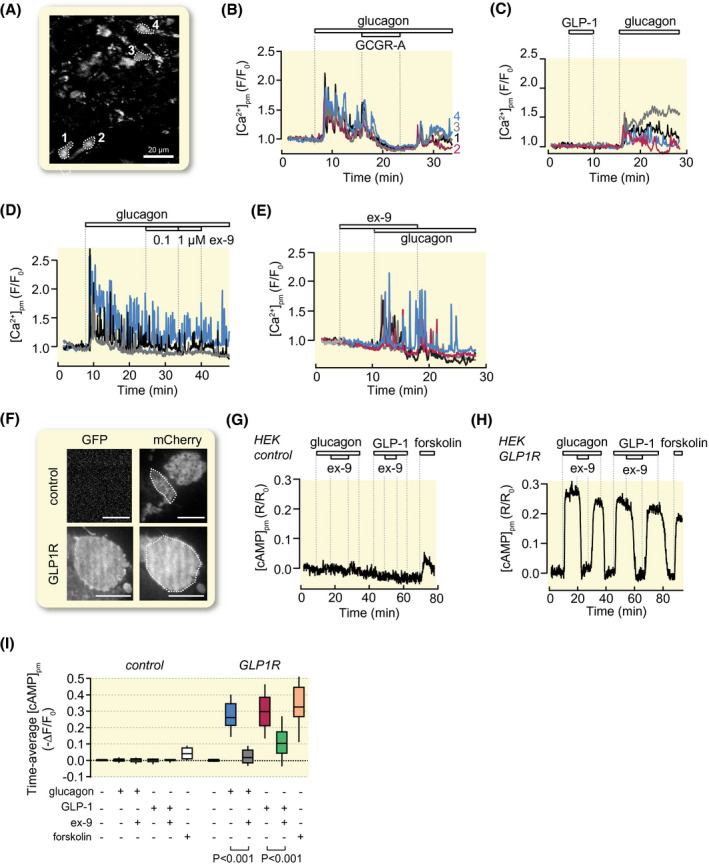
FIGURE 2.

GLP‐1 and ex‐9 do not affect glucagon receptor signalling whereas glucagon promotes cAMP production via GLP‐1 receptors. A‐E, Recordings of [Ca2+]pm from single glucagon receptor‐expressing reporter cells loaded with the fluorescent Ca2+ indicator fluo‐4. A, TIRF image (491/527 nm exc/em) of fluo‐4‐loaded reporter cells. B, Glucagon (10 nmol/L) induces [Ca2+]pm signalling that is reversibly inhibited by 1 µmol/L of glucagon receptor antagonist (GCGR‐A). Representative example traces from the cells highlighted in (A) out of 102 cells in seven experiments. C, GLP‐1 (100 nmol/L) lacks effect while glucagon triggers [Ca2+]pm signalling. Representative for 61 cells from six experiments. D, Ex‐9 fails to reverse [Ca2+]pm signalling evoked by glucagon. Representative for 135 cells from eight experiments. E, Pre‐exposure to 1 µmol/L ex‐9 does not prevent the [Ca2+]pm‐elevating effect of 10 nmol/L glucagon. Representative for 61 cells from 4 experiments. F‐I, Recordings of [cAMP]pm from HEK293 cells expressing GFP‐tagged GLP‐1 receptors. F, TIRF images of HEK293 cells transfected with an mCherry‐based cAMP translocation biosensor together or not with a GFP‐tagged GLP‐1 receptor construct. Scale bar, 10 µm. G, Effects of 10 nmol/L glucagon, 1 µmol/L ex‐9, 10 nmol/L GLP‐1 and 10 µmol/L forskolin on [cAMP]pm in control cells lacking GLP‐1 receptors. Representative for 24 cells from three experiments. H, Similar as in G but with cells expressing GLP‐1 receptors. Representative for 43 cells from three experiments. I, Box plots of the time‐average [cAMP]pm from experiments as shown in G and H. P values are given for the comparison of mean values with Student's paired t test
