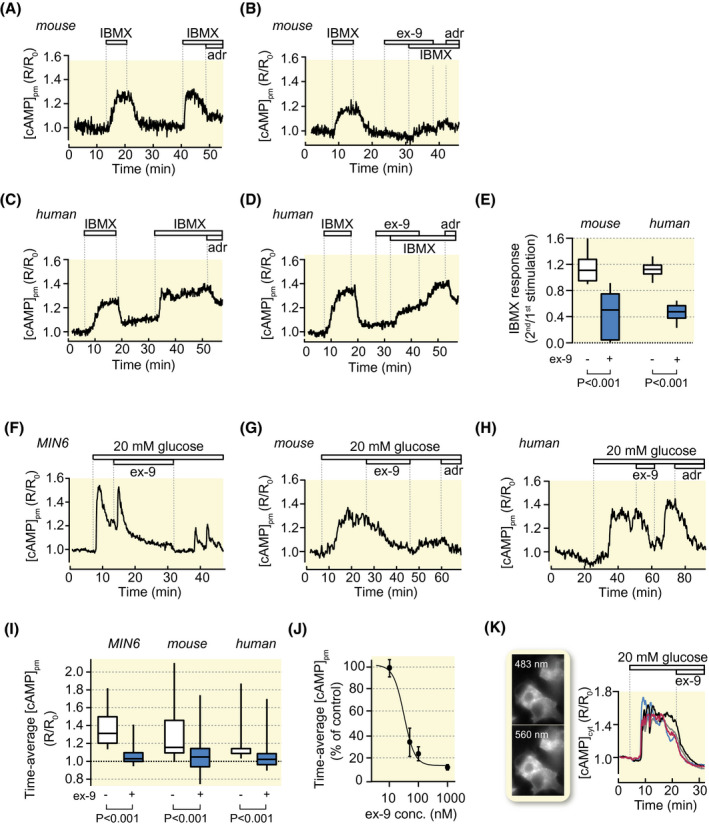
FIGURE 3.

GLP‐1 receptor antagonism suppresses basal cAMP production and glucose‐induced [cAMP]pm elevations. A, [cAMP]pm recording from a single β‐cell within an intact mouse islet during two consecutive exposures to IBMX. Representative for 27 cells from three experiments. B, As in A but with 1 µmol/L ex‐9 introduced before the second IBMX exposure. Representative for 57 cells in nine experiments. C and D, As in A and B but with human β‐cells. Representative for 28 cells for control and 22 cells with ex‐9, both groups derived from four experiments with islets from a single donor. E, Box plots of the amplitudes of the second IBMX stimulation normalized to the first based on experiments as shown in A‐D. F, [cAMP]pm recording from a single MIN6 β‐cell exposed to an increase of the glucose concentration from 3 to 20 mmol/L. Ex‐9 at 1 µmol/L reversibly suppresses the glucose‐induced [cAMP]pm elevation. Representative for 84 cells from six experiments. G, H, [cAMP]pm recordings from β‐cells within intact mouse (G, representative for 28 cells from 11 experiments) or human islets (H, 24 cells from five experiments with islets from four donors), showing that ex‐9 suppresses the [cAMP]pm increase induced by elevation of glucose from 3 to 20 mmol/L. The lack of effect or lowering of [cAMP]pm in response to 10 µmol/L adrenaline (adr) is used as indication of β‐cell identity. I, Box plots for [cAMP]pm after stimulation with 20 mmol/L glucose and exposure to ex‐9. P values refer to statistical comparisons made with Wilcoxon signed‐rank test. J, Means ± SEM for the effect of different concentrations of ex‐9 on glucose‐induced [cAMP]pm elevation in MIN6 β‐cells. n = 7 to 24 cells for each data point. K, Wide‐field fluorescence microscopy images and recordings of cytoplasmic cAMP from MIN6 cells stimulated by increase of glucose from 3 to 20 mmol/L and subsequently exposed to 100 nmol/L ex‐9. Representative for 63 cells from three experiments
