
FIGURE 5.
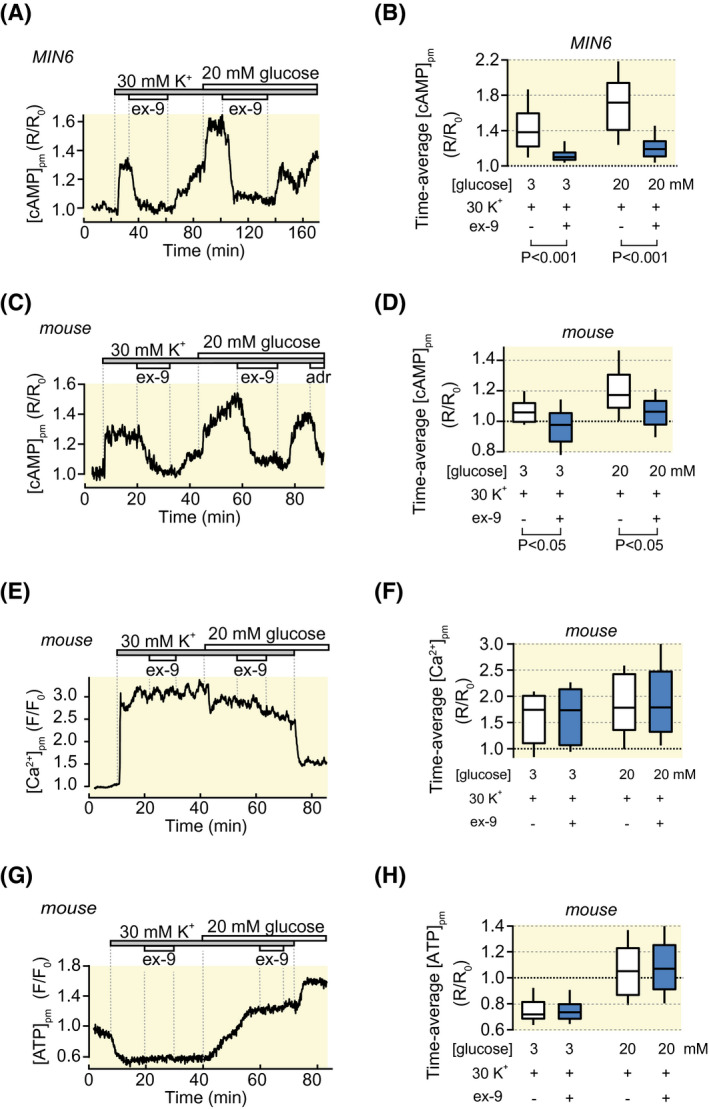
Ex‐9 suppresses Ca2+‐stimulated [cAMP]pm increases. A, [cAMP]pm recording from a single MIN6 β‐cell showing that 1 µmol/L ex‐9 suppresses [cAMP]pm increases induced by depolarization and glucose stimulation in the continuous presence of 250 µmol/L diazoxide. Representative for 95 cells from five experiments. B, Box plots showing the effects of high K+, glucose and ex‐9 on [cAMP]pm. P values refer to statistical comparisons made with Wilcoxon signed‐rank test. C, Similar as in (A) but for mouse islet β‐cells. The [cAMP]pm ‐lowering effect of 10 µmol/L adrenaline (adr) is used to verify the identity of islet β‐cells. Representative for 10 cells from five experiments. D, Box plots showing the effects of high K+, glucose and ex‐9 on [cAMP]pm. P values are given for comparisons of mean values with Student's paired t test. E, [Ca2+]pm recording from a single β‐cell within an intact mouse islet showing that ex‐9 lacks effect on depolarization‐induced [Ca2+]pm increases in the presence of diazoxide and 3 or 20 mmol/L glucose as in (C). Representative for 30 cells from eight experiments. F, Box plot for the effects of K+, glucose and ex‐9 on [Ca2+]pm. G, Recording of [ATP]pm under similar conditions as in (E). Representative for 42 cells from three experiments. H, Box plots showing the effects of K+, glucose and ex‐9 on [ATP]pm