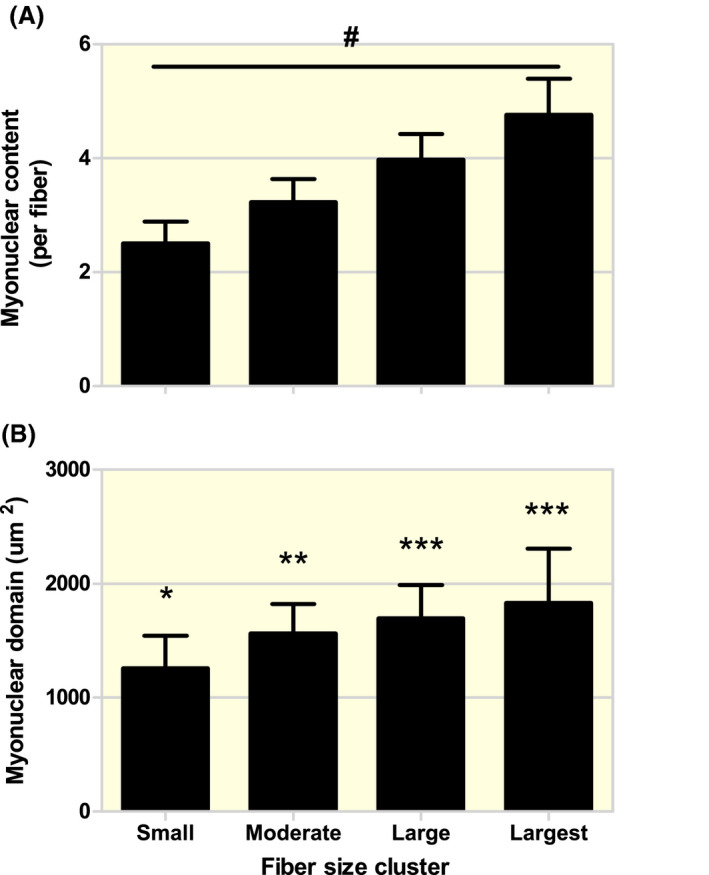
FIGURE 1.

Baseline myonuclear content (A) and domain size (B) within the different muscle fibre size clusters. Small: cluster with fibres between 2000 and 3999 µm2, Moderate: cluster with fibres between 4000 and 5999 µm2, Large: cluster with fibres between 6000 and 7999 µm2, Largest: cluster with fibres between 8000 and 9999 µm2. Data are expressed as Mean ± SD. #All groups are significantly different from each other, P < .05. *Significantly different compared with Moderate, Large and Largest, P < .05. **Significantly different compared with Small, Large and Largest, P < .05. ***Significantly different compared with Small and Moderate, P < .05
