Figure 3.

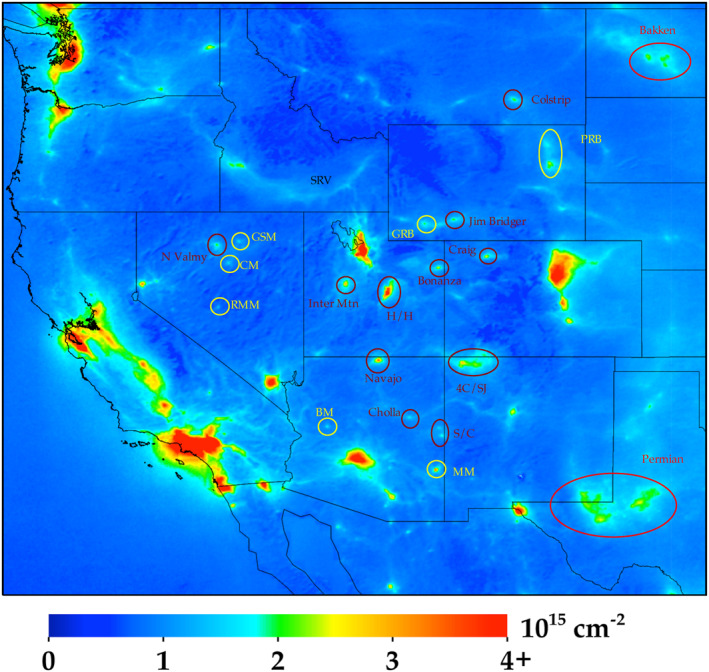
Same data shown in Figure 2, but now zoomed into the western United States. Power plants are outlined in dark magenta, mining operations in yellow, and oil & gas in bright red.

Same data shown in Figure 2, but now zoomed into the western United States. Power plants are outlined in dark magenta, mining operations in yellow, and oil & gas in bright red.