Figure 8.

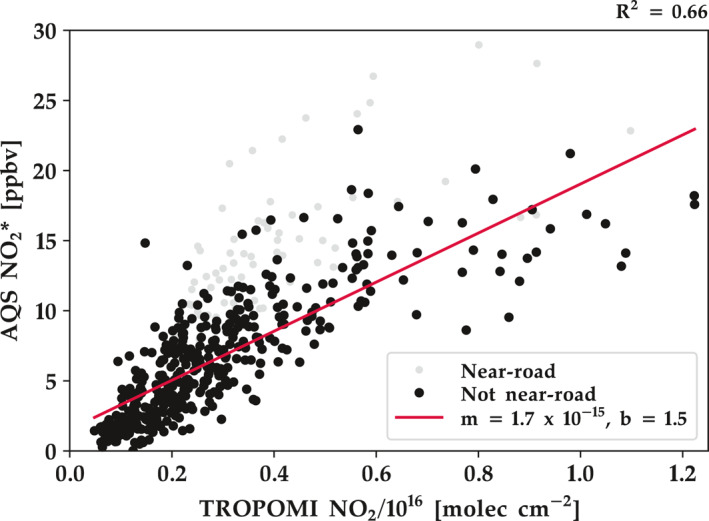
EPA AQS annual surface NO2* observations for 2019 compared to the collocated oversampled 0.01° × 0.01° TROPOMI value during the same timeframe. R2 represents the correlation between TROPOMI and not near‐road monitors.

EPA AQS annual surface NO2* observations for 2019 compared to the collocated oversampled 0.01° × 0.01° TROPOMI value during the same timeframe. R2 represents the correlation between TROPOMI and not near‐road monitors.