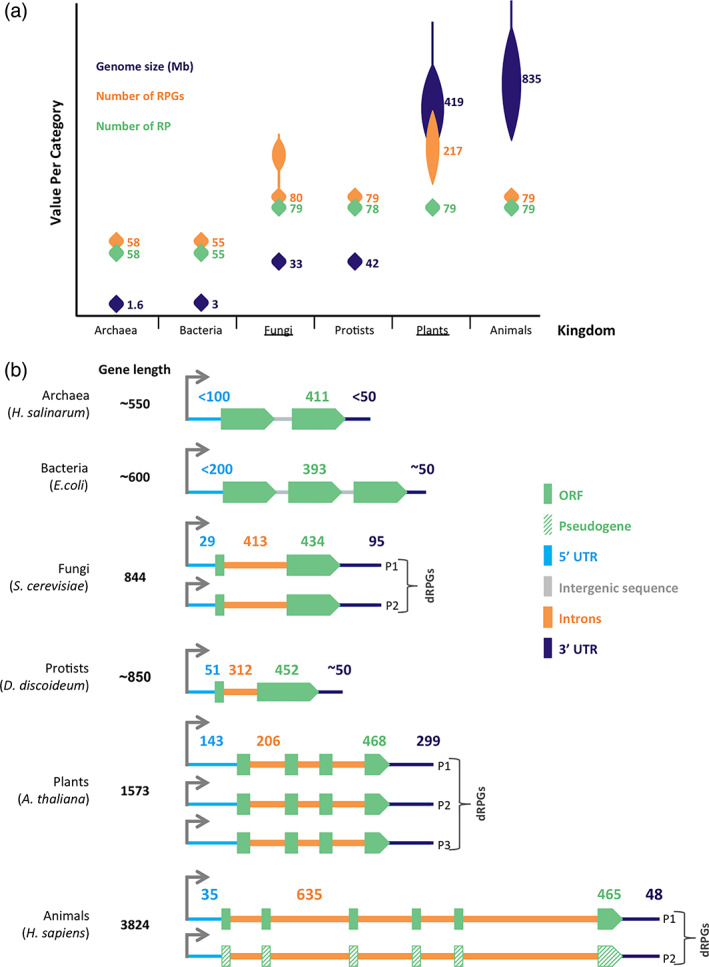
FIGURE 1.

Ribosomal protein gene structure and distribution in the main kingdoms of life. (a) The number of ribosomal protein genes increases in duplicated genomes independent of the protein number and genome size. Genome sizes in mega bases (Mb) are illustrated based on data from NCBI genome browser overview tool for over 300 genomes per kingdom with the median size, the median number of ribosomal protein (RP) and RP genes (RPGs) calculated from 3 to 14 species per kingdom based on information taken from Ribosomal Protein Gene Database. Kingdoms with most genome duplication events are underlined. (b) General features of the different classes of RPGs. The most common structure of RPGs in a representative species from each of the six kingdoms of life are schematically illustrated to indicate the differences in gene size, regulatory region, and the gene organization in the genome. Green boxes, orange lines, gray lines, and blue lines represent the open reading frame (ORF), the introns, the intergenic sequences, 5′ and 3′ UTRs, respectively. The median size of the genes (bp) and ORFs are based on data from NCBI genome browser, SGD, Ribosomal Protein Gene Database, and ThaleMine (Yoshihama et al., 2002). The median number of introns per RPGs are illustrated on each schematic, while the median sizes (bp) of UTRs, ORF and introns are shown on top. Two or more copies of the same genes are shown for species with documented genome duplication events and pseudogenes are represented by green stripped boxes. In most cases the regulatory sequences (UTRs and introns) often vary between species, between genes, and even between duplicated genes. The UTR and gene sizes for archaea and bacteria are estimates based on limited number of genes that are likely to vary as more accurate mapping of the untranslated regions in these species becomes available. The transcription start sites are shown by the gray arrows on top
