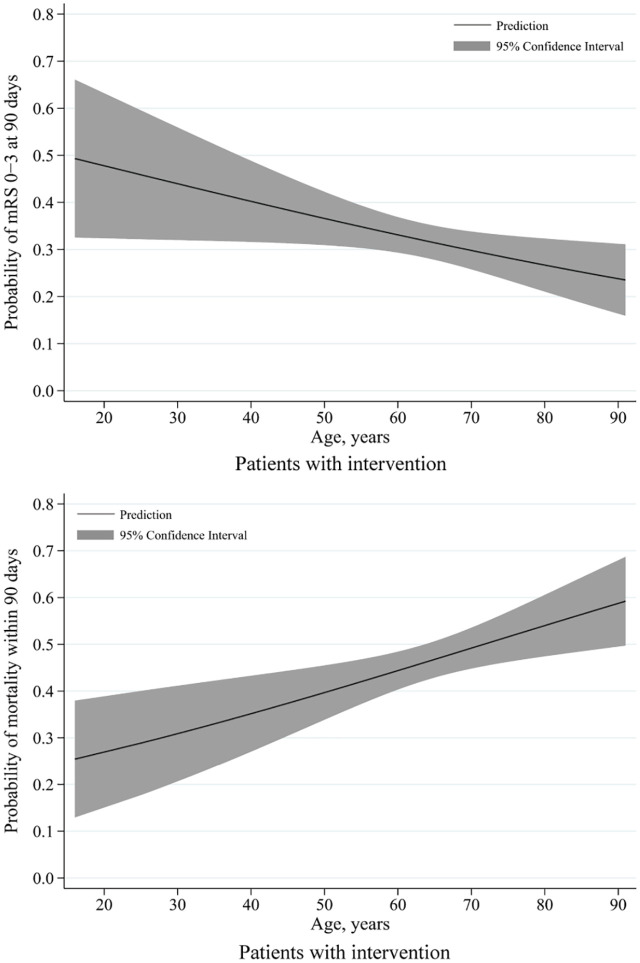
Figure 4.
Predicted probability of clinical outcome by age in patients with intervention.
Of all patients with intervention, the curves showed that decreases in predicted probabilities of favorable functional outcome and increases in predicted probabilities of mortality with age.
The solid line indicates the predicted probability of outcomes and grey shading indicates the 95% confidence interval.

