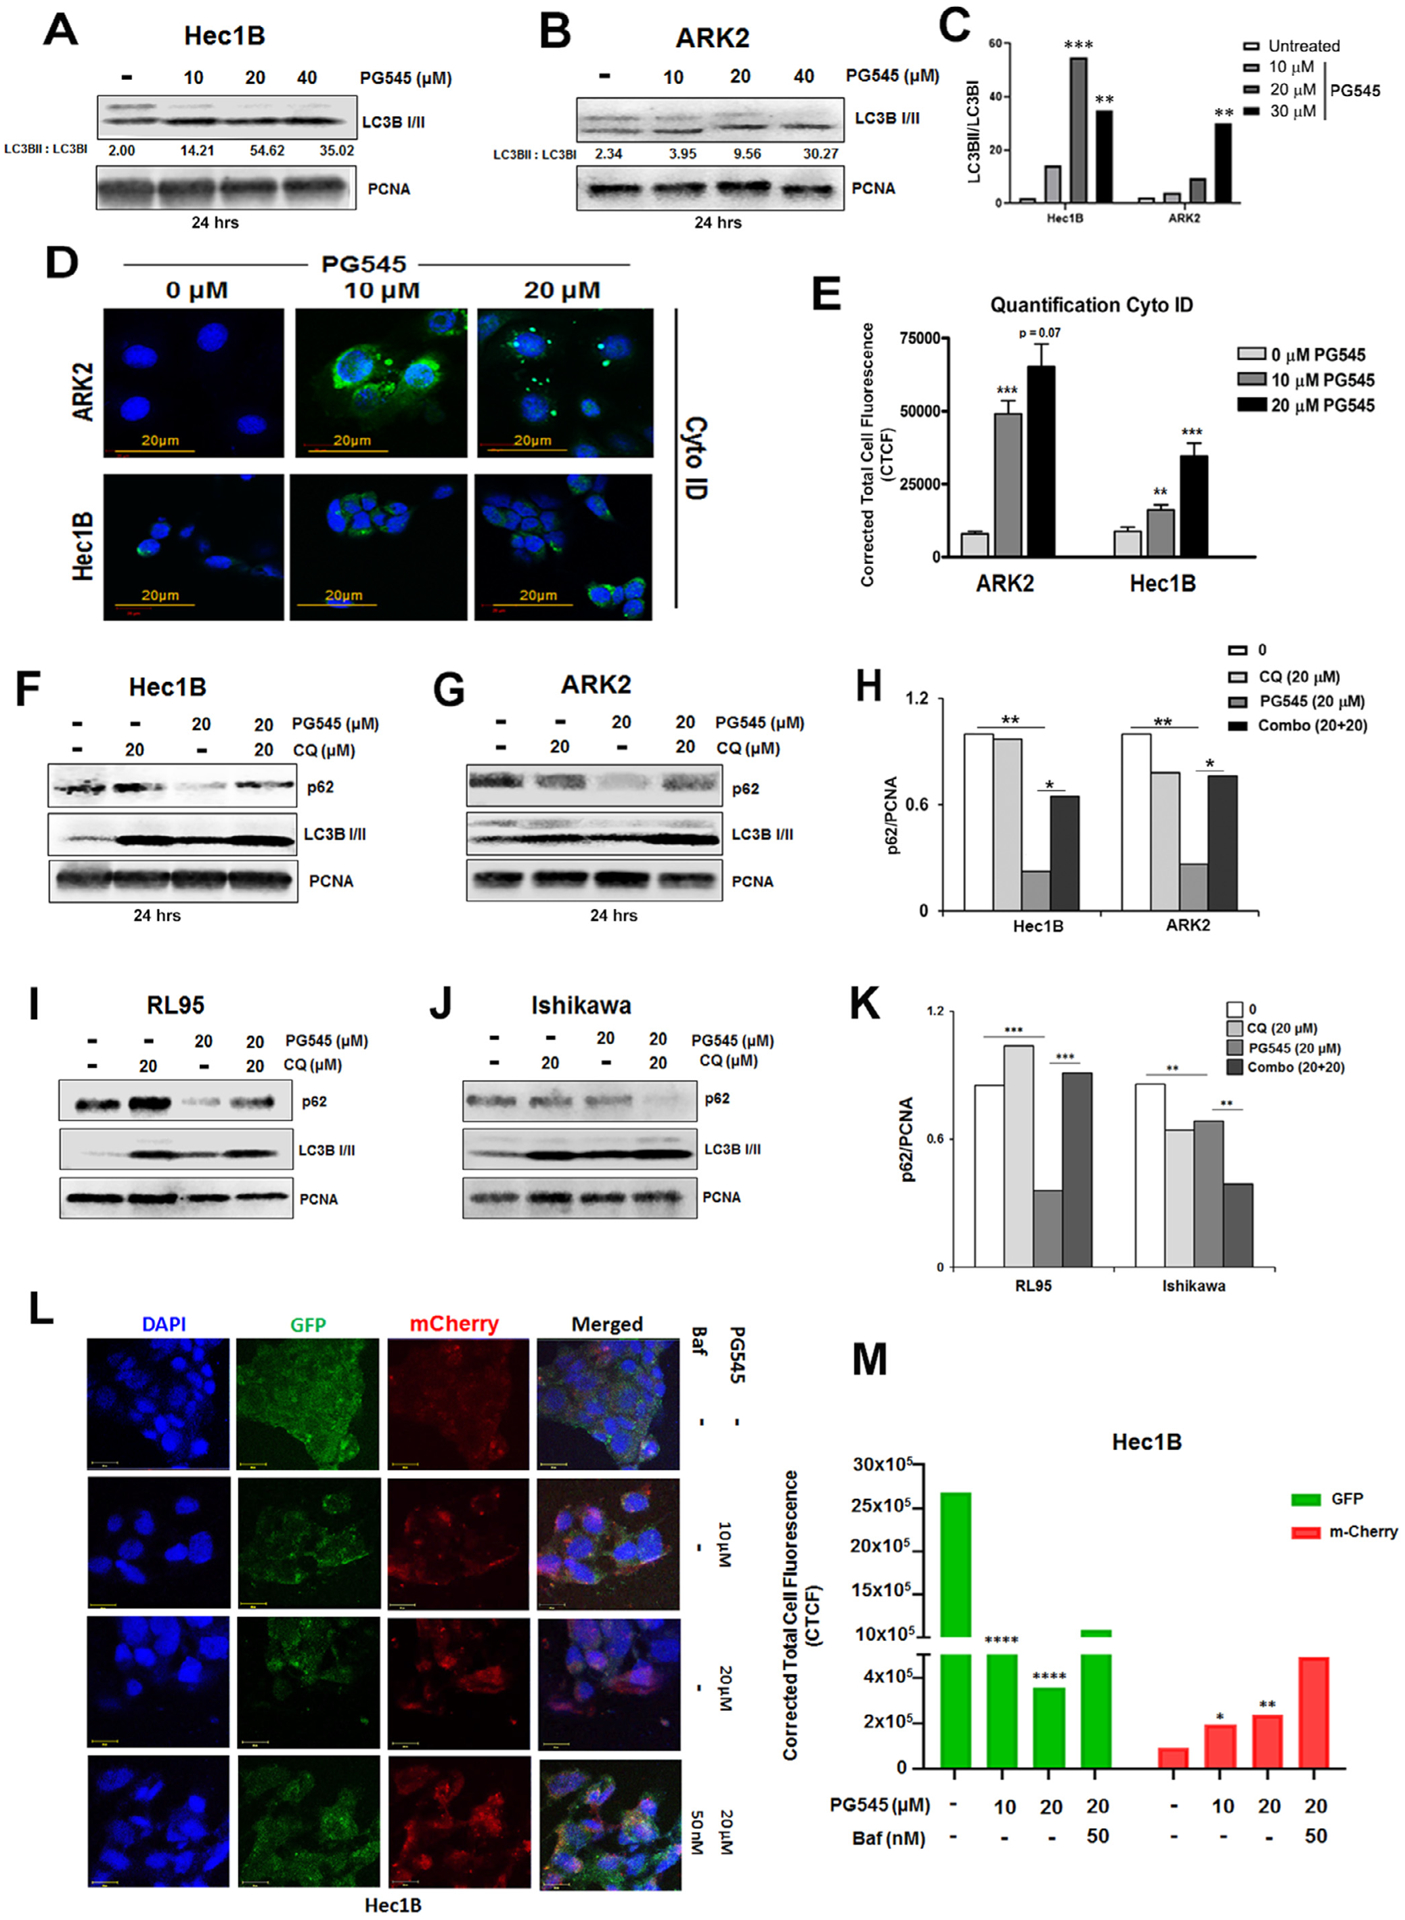
Fig. 4.

PG545 induces autophagy Hec1B (A) and ARK2 (B) cells. Immunoblot analyses are shown for Hec1B and ARK2 cell lysates treated with 10, 20 and 40 μM PG545 for 24 h. The ratio of LC3BII over LC3BI was measured in 4C. Cyto ID staining was used to demonstrate the autophagosome formation in ARK2 and Hec1B cells (4D). Quantification of Corrected Total Cell Fluorescence (CTCF) was conducted by using ImageJ software (E). Autophagic flux was also investigated in Hec1B (F) and ARK2 (G) cells. Cells were either treated with 20 μM PG545 and/or with chloroquine. Both compounds were added for 24 h. Cell lysates were analyzed by Western blot using antibodies to LC3BI/II, p62 and PCNA. The level of p62 over PCNA was measured in H. P values: ns = not significant, * < 0.05, ** < 0.01, *** < 0.001. Autophagic flux was investigated in RL95-2 (I) and Ishikawa (J) cells similarly to Fig. 4 F, G. The level of p62 over PCNA was measured in K. L, Transient expression of Cherry-GFP-LC3B (48 h of incubation), autophagic flux was determined in Hec1B cells incubated with 10 μM and 20 μM PG545 for 24 h and co-treated with Bafilomycin 1A for 12 h. Confocal microscopy analysis depicts alterations in the autolysosome formation. Quantification of Corrected Total Cell Fluorescence (CTCF) for both GFP and m-Cherry was conducted by using ImageJ software (M).
