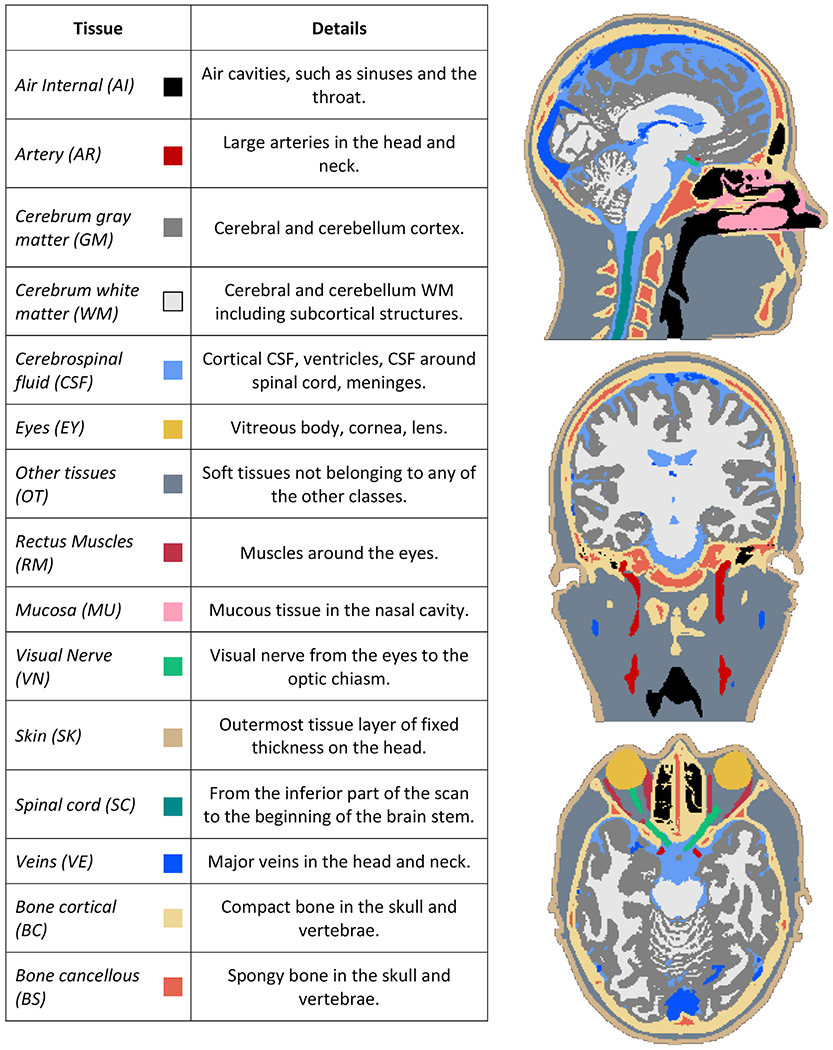
Fig. 1.

On the left: list of the different head tissues, and what they are comprised of, segmented from the imaging data. On the right: an example reference segmentation where the tissues are color-coded according to the colors in the table. Note the spatial detail of the extra-cerebral tissues, and the coverage of the neck region.
