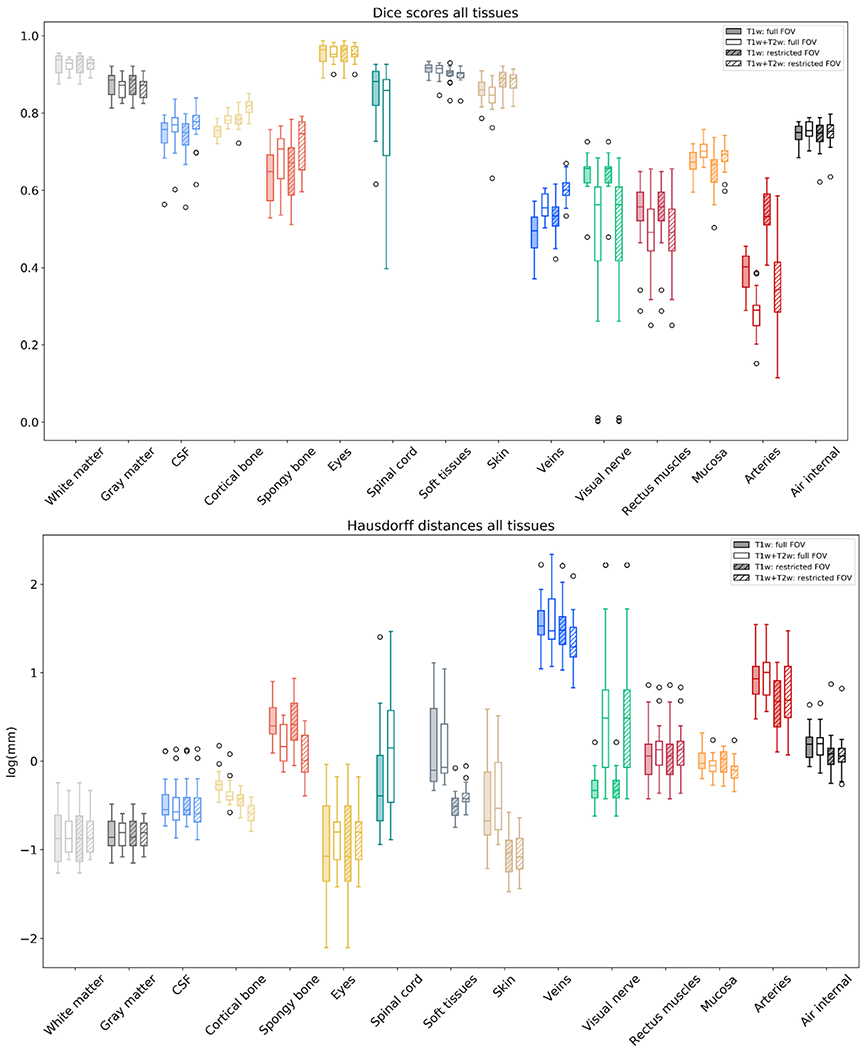
Fig. 4.

The Dice scores and modified Hausdorff distances (natural log scale) over all 15 tissue classes segmented by CHARM. The filled boxes correspond to the case where only a T1w scan is used as an input, and the non-filled boxes to a case where both T1w and T2w scans are used as inputs. The striped boxes correspond to a case where the FOV was restricted to the upper part of the head. On each box, the line marks the median, the box extends to lower and upper quartiles, whiskers extend up to 1.5 times the interquartile range, and data points beyond that are marked as outliers. The color-coding of the tissues matches the color-coding of the segmentations for example in Figs. 5 and 6.
