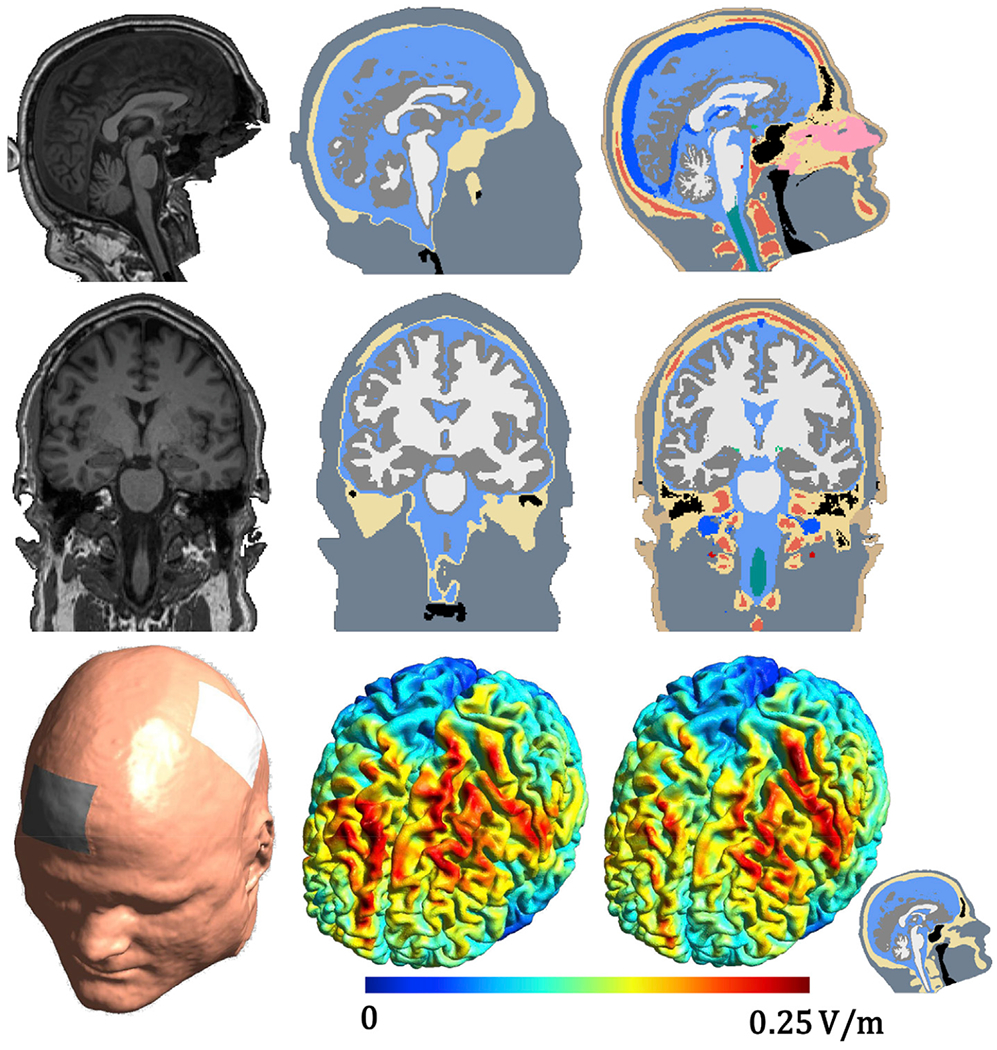
Fig. 7.

Example subject from the data set described in (Csifcsák et al., 2018). The first column shows the MR scan along with the electrode locations, the second column the segmentations and e-field simulation from HEADRECO, and the third column the segmentations and e-field simulation from CHARM. The small emblem in the lower right corner denotes that the CHARM simulations were run on a head model with the standard five tissues and not all fifteen that are segmented.
