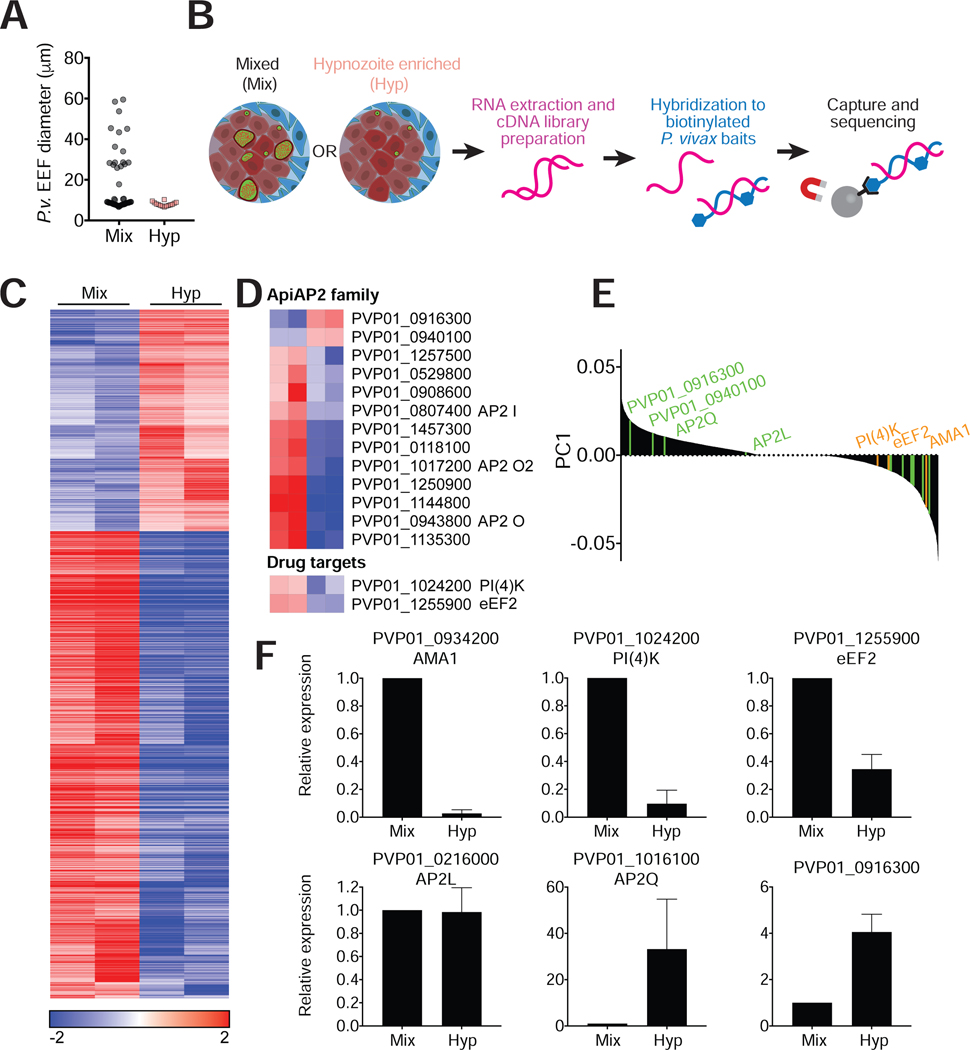
Figure 4: RNA-seq reveals differential expression patterns between hypnozoites and schizonts.
(A) Cultures were treated with a PI(4)K inhibitor in radical cure mode to enrich for hypnozoites. Drug was removed on day 8 pi and cultures were kept for one additional day in media before processing. Diameters of EEFs remaining in culture on day 9 were plotted for treated and untreated cultures.
(B) Schematic of sample processing. RNA extraction was performed on mixed and hypnozoite enriched cultures on day 9. cDNA libraries were hybridized to P. vivax specific baits for enrichment before sequencing.
(C) Heat map was generated for transcripts with adjusted P value (Padj)<0.01. Median log-transformed TPM values were calculated for each gene and the log2-fold-changes over the median was calculated for each sample. The resulting matrix was subjected to hierarchical clustering (two biological replicates per condition).
(D) Top heat map shows differential representation of ApiAP2 genes in mixed versus hypnozoite-enriched samples (Padj<0.01). Bottom heat map shows differential representation of drug targets PI(4)K and eEF2.
(E) Principal component analysis where positive values are biased towards hypnozoite-enriched samples. Genes in the ApiAP2 family are indicated in green and additional genes for which quantitative RT-PCR analysis was performed are indicated in orange.
(F) qRT-PCR analysis of 5 representative genes in non-captured RNA samples (mean±sem from at least 3 biological replicates of which one is an independent sample, not used for hybrid selection.)

