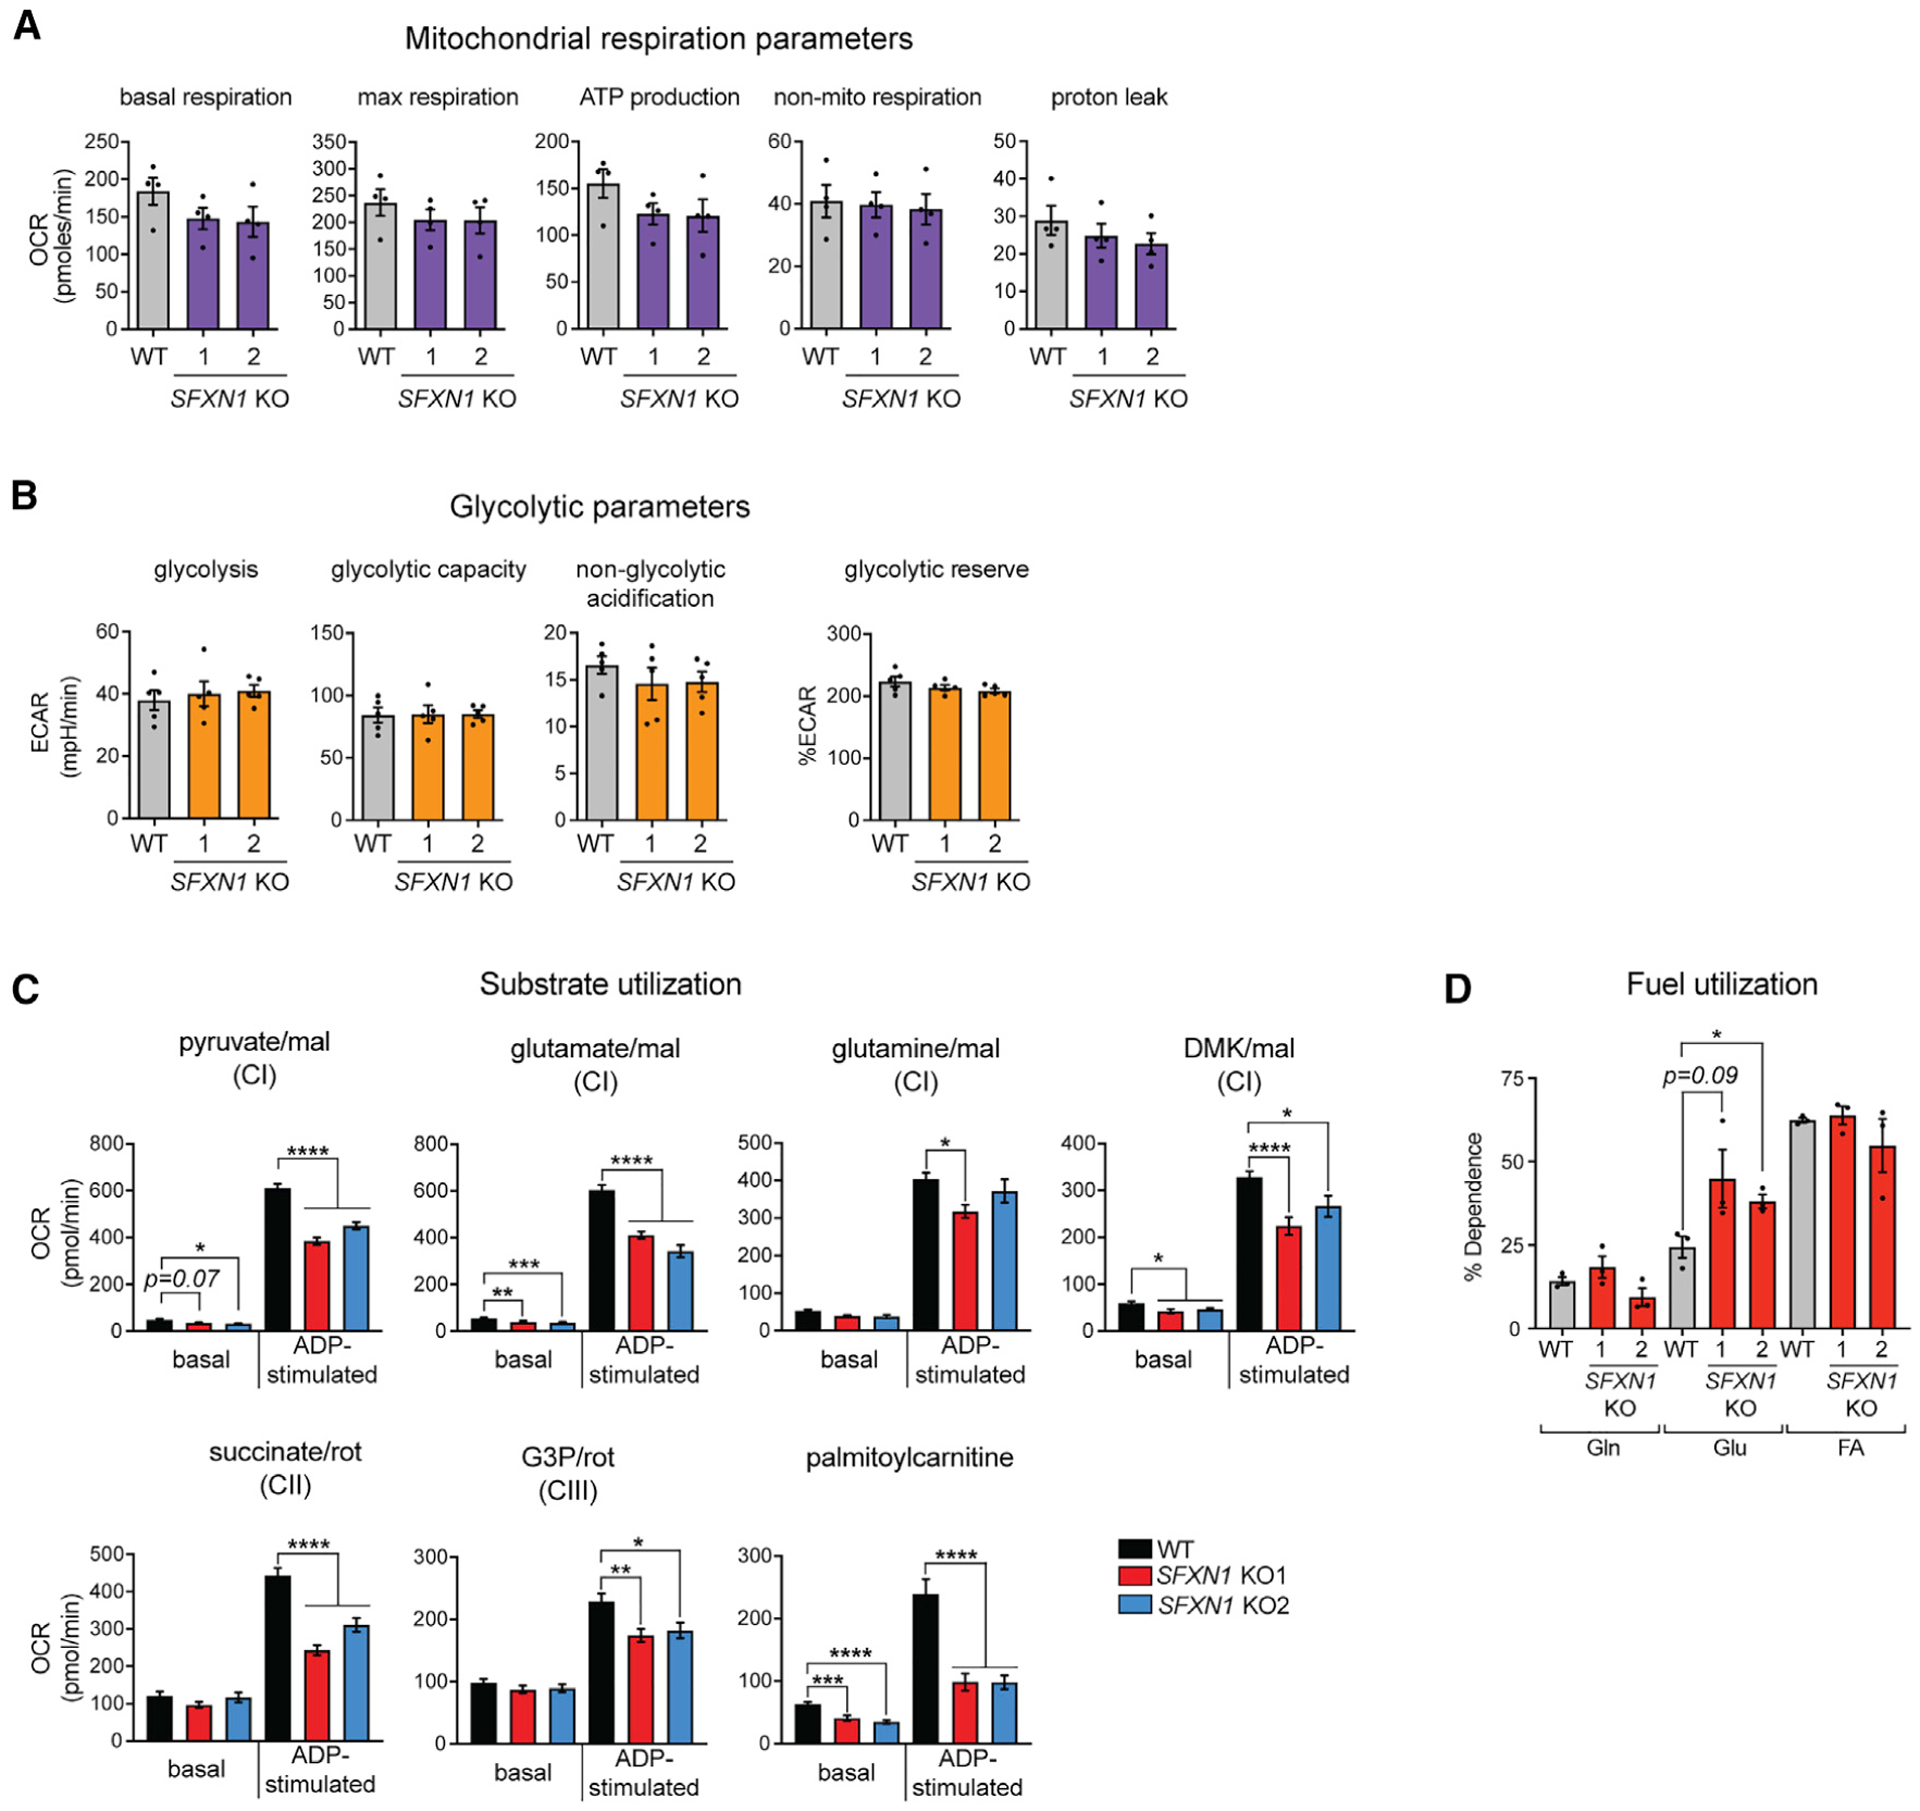
Figure 5. Cells lacking SFXN1 display metabolic flexibility.

(A) Oxygen consumption rate (OCR) in intact cells. Presented are values normalized by DNA content (mean ± SEM, n = 4).
(B) Extracellular acidification rate (ECAR) in intact cells. Presented are values normalized by DNA content (mean ± SEM, n = 5).
(C) OCR in isolated mitochondria using the specified substrates (mean ± SEM, n ≥ 9 wells from at least 3 independent experiments). mal, malate; DMK, dimethyl αKG; G3P, glycerol-3-phosphate.
(D) Percent dependency on glutamine (Gln), glucose (Gluc), and fatty acid (FA) use (mean ± SEM, n = 3). *p < 0.05, **p < 0.01, ***p < 0.001, ****p < 0.0001; unpaired Student’s t test.
