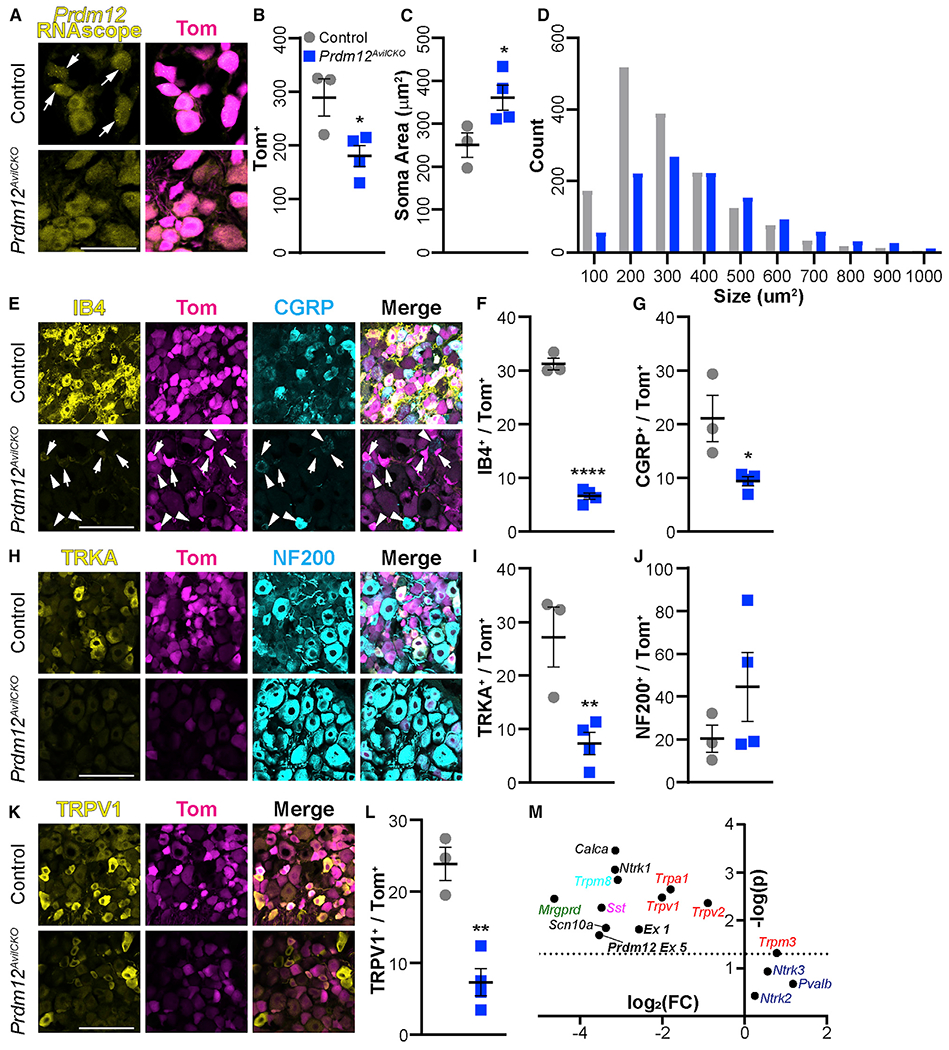
Figure 4. Nociceptor populations are reduced in Prdm12AvilCKO mice.

(A) RNAscope using exon-V-specific probes confirmed knockout of Prdm12 from mutant DRGs. Scale bar, 50 μm.
(B) Prdm12AvilCKO mice have a reduction of Tom+ neurons, p = 0.0326.
(C and D) The remaining neurons in Prdm12AvilCKO are larger, on average (C) (p = 0.0466), because of selective loss of cells ≤ 300 μm2 (D).
(E) Representative image showing number of IB4+ (arrows) and CGRP+ (arrowheads) nociceptors are reduced in Prdm12AvilCKO DRGs. Scale bar, 100 μm.
(F and G) Quantification of IB4+ (F) (p < 0.0001) and CGRP+ (G) (p = 0.027) nociceptors as a percentage of the total Tom+ population of sensory neurons.
(H) Representative image of TRKA+ nociceptors and NF200+ myelinated neurons in Prdm12AvilCKO and control mice. Scale bar, 100 μm.
(I) Quantification showing significant reduction of TRKA+ nociceptors, p = 0.0135.
(J) Quantification of NF200+ neurons showing a wide range in Prdm12AvilCKO mice, but no significant change from control littermates, p = 0.278.
(K and L) Representative image (K) and quantification (L) of the reduction in number of TRPV1+ nociceptors, p = 0.0025. Scale bar, 100 μm.
(M) qRT-PCR results plotted showing —log(p) versus log2 (fold change) reveal significant reductions in many nociceptive gene transcripts, including Prdm12, but a significant increase in Trpm3, and no change in touch and proprioceptive genes. The dotted line represents p = 0.05; points above it differ significantly between control and mutant mice. Each point represents the analysis of significance and fold change from average values of n = 3 biological replicates.
All analysis was completed using DRGs from lumbar levels 2 through 5. Each data point in (B), (C), (F), (G), (I), (J), and (L) represents the average count across three DRGs from control (n = 3) or Prdm12AvilCKO (n = 4) mice taken after behavior analysis around 10 weeks of age. All quantification analyzed by two-tailed Student’s t test; results are presented as means ± SEM.
