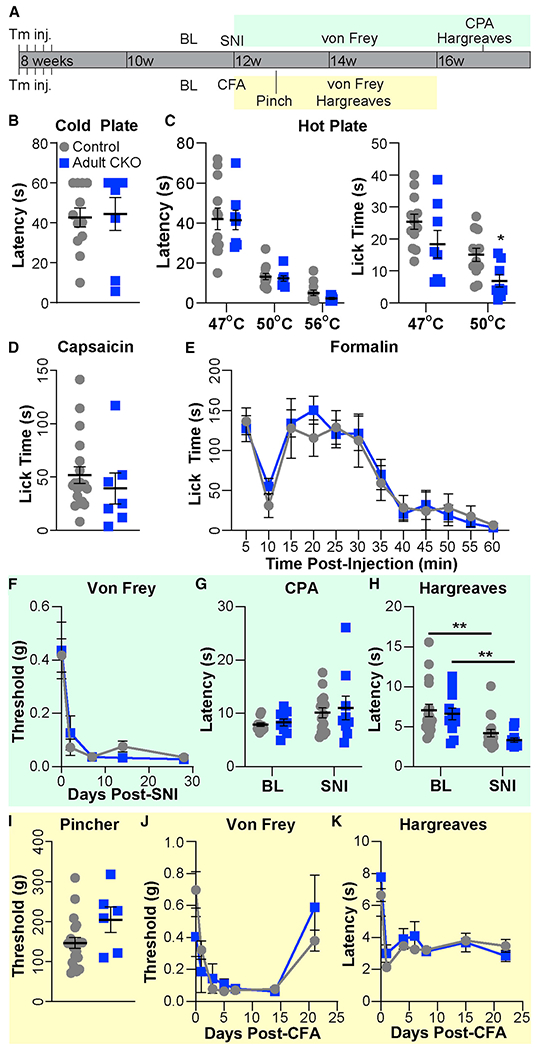
Figure 5. Knockout of Prdm12 in adulthood does not substantially reduce pain sensitivity in naive or injured mice.

(A) Schematic showing experimental timeline.
(B) No difference was observed in reaction time on a cold plate between Prdm12AvilERT2CKO (adult conditional gene knockout [CKO], n = 8) and control (n = 12) mice (both 50/50 M:F).
(C) Although no difference was observed at 47°C, adult CKO mice spent significantly less time licking on a 50°C hot plate, p = 0.0126. No differences were found in the reflexive response on hot plate at any temperature.
(D and E) No difference was observed between Prdm12AvilERT2CKO (n = 7, 3:4 M:F) and control (n = 19, 11:8 M:F) in the time spent licking after capsaicin (D) or formalin (E) injection into the hindpaw. (F–H) Behavioral results before and after SNI.
(F) Time course of withdrawal thresholds for Prdm12AvilERT2CKO (n = 12, 5:7 M:F) and control (n = 18, 8:10 M:F) mice showing both groups developed mechanical allodynia after SNI.
(G) Responses of control (n = 15, 7:8 M:F) and Prdm12AvilERT2CKO (n = 9, 5:4 M:F) mice to cold plantar assay (CPA) did not differ significantly at baseline or 4 weeks after SNI.
(H) Both groups experienced heat hyperalgesia 4 weeks after SNI but did not differ from each other (control versus adult CKO) at either time point. Same n as (F), control p = 0.0044, Prdm12AvilERT2CKO p = 0.0078.
(I–K) Behavioral results after CFA injection.
(I) No difference was observed in the withdrawal threshold to paw pinch between Prdm12AvilERT2CKO (n = 6, 3:3 M:F) and control (n = 21, 12:9 M:F) mice, which was tested 3 days after CFA injection. Note that withdrawal thresholds are several-fold higher because of the larger area over which pressure is applied with the rodent pincher compared with von Frey filaments.
(J) Time course of withdrawal thresholds showing both groups developed tactile allodynia after CFA and recovered over the same time period. Same n as (I). (K) Both groups developed heat hyperalgesia after CFA injection. Same n as (I).
Statistical analysis by 2-way ANOVA with post hoc Tukey tests when a significant difference was detected for (E)–(H), (J), and (K); two-tailed Student’s t tests for other datasets. Results are presented as means ± SEM.
