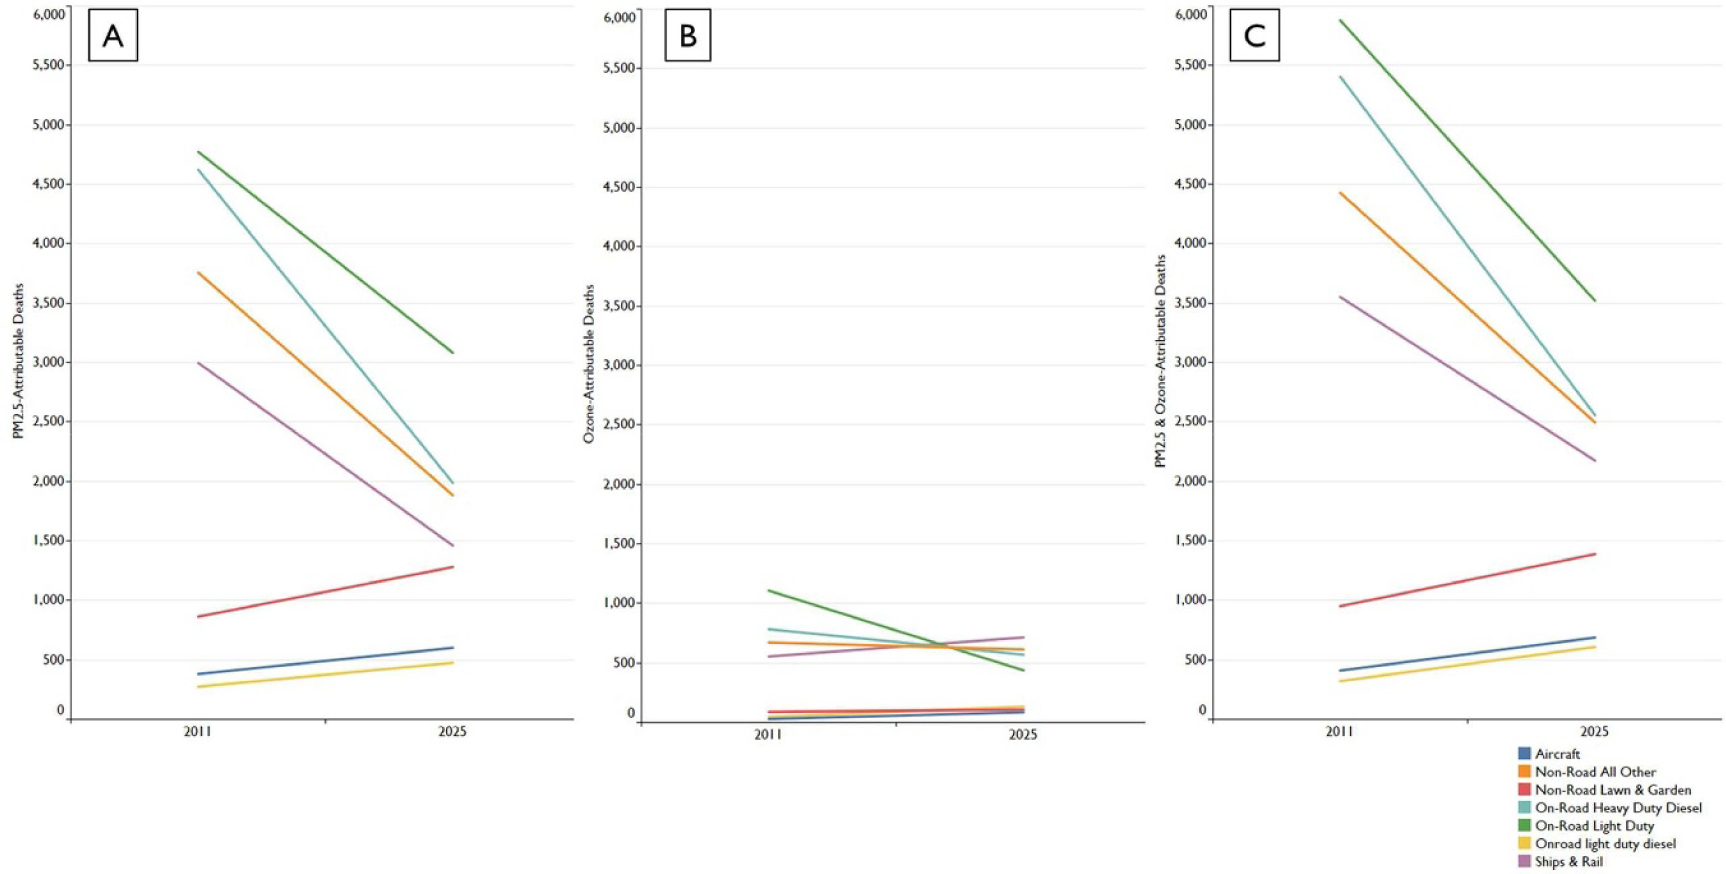
Figure 1.

Trend of air pollution-related deaths over time by pollutant and mobile sector source. Each colored line represents a subset of 17 separate mobile emissions sources. Panel A presents PM2.5-related deaths over time by sector. Panel B presents ozone-related deaths over time by sector. Panel C presents total (PM2.5 + ozone) deaths over time by sector.
