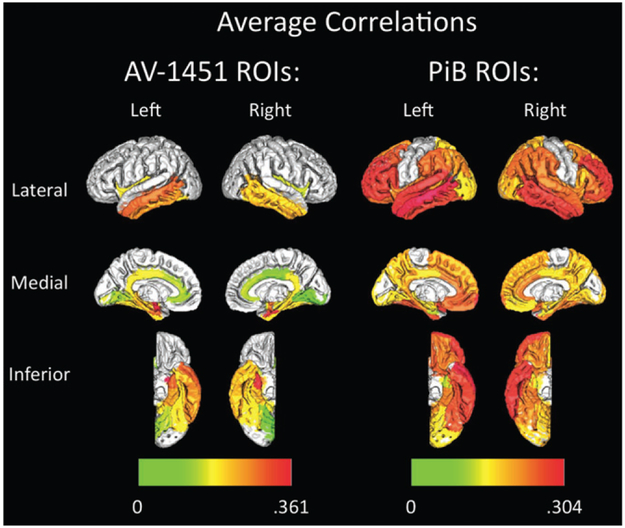
Figure 3.
AV-1451 (left) and PiB (right) average inter-tracer region-of-interest correlation map imposed on a template brain. Color bars at bottom indicate average of all significant (p < 0.05) correlation coefficients, when testing the associations between a given region in one modality (e.g., left inferior temporal AV-1451) with all tested brain regions in the other modality (e.g., all Braak I-V PiB).

