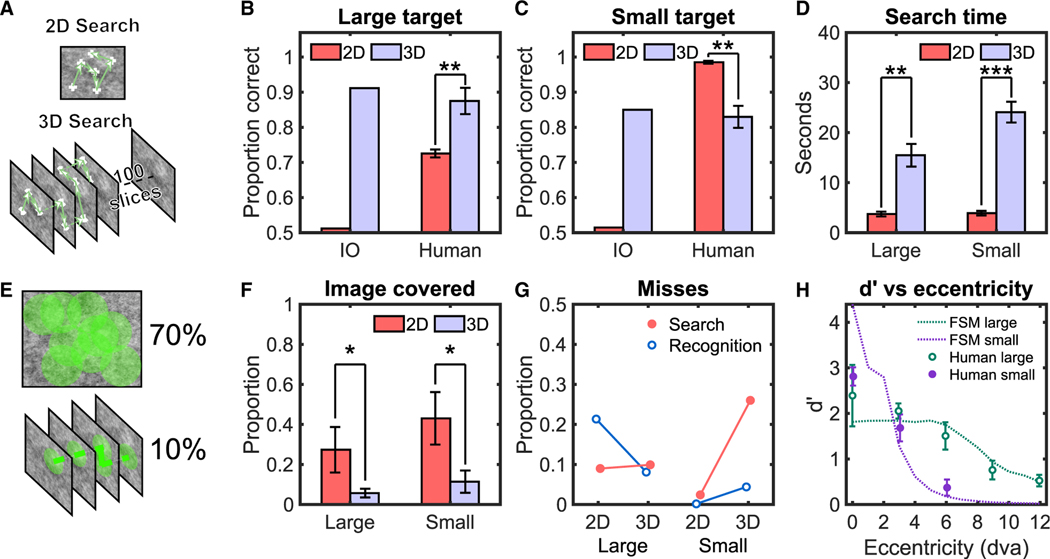
Figure 1. Human and Ideal Observer Results for 2D and 3D Search in Filtered Noise.
(A) A sample 2D image (top) and slices of a 3D volume (bottom) of filtered noise images with fixations and scrolls of a search by a human observer.
(B) Proportion correct for target detection for human observers and an ideal Bayesian observer (IO) for the large target. To avoid ceiling effects, IO performance was degraded with internal noise to approximately match human performance in 3D for each target type. The same value of internal noise was then used for the IO’s 2D search (STAR Methods).
(C) Proportion correct for target detection for human observers and IO for the small target.
(D) Average search time measured for human observers.
(E) A sample of the image covered for a 2D trial (top) and a 3D trial (bottom) with a useful field of view (UFOV) of 2.5° radius.
(F) Average proportion of image covered by human observers’ UFOV.
(G) Search and recognition errors for human observers.
(H) Symbols: average human target detectability (d’) versus retinal eccentricity for small and large targets during brief presentations of 2D images (500 ms).
Continuous lines: fit of the foveated search model (FSM) (STAR Methods).
Error bars are ±SEM. *p < 0.05; **p < 0.01; ***p < 0.001. See also Figure S1.

