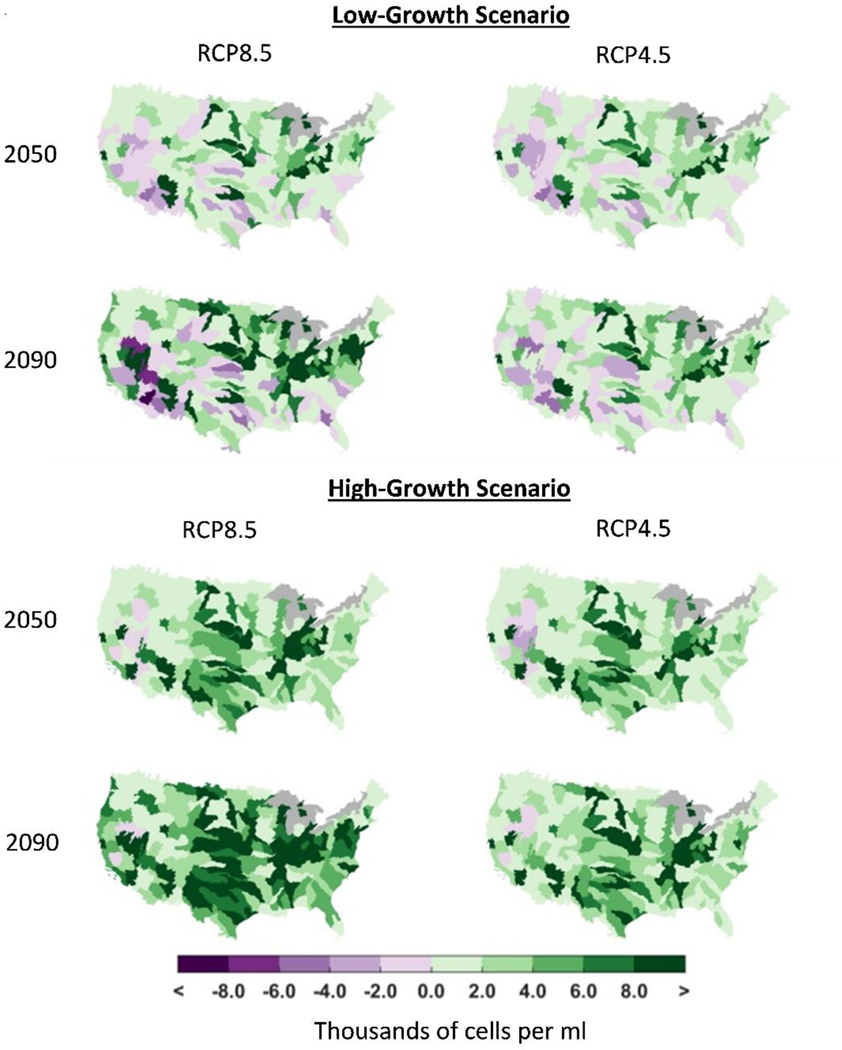
FIGURE 6.
Changes in average annual water body surface cyanobacteria (thousands of cells per mL) for a low growth (plateaus as temperatures reach 26°C) and a high growth scenario (assumes a linear growth rate with changes in temperature) in 2050 (2040–2059) and 2090 (2080–2099) relative to a control scenario. Values for each representative concentration pathway (RCP) are associated with the average results for five future scenarios and are aggregated to the four-digit hydrologic unit code level, weighted by water body surface area. See USEPA (2017) and Chapra et al. (2017) for information about the modeling approach.

