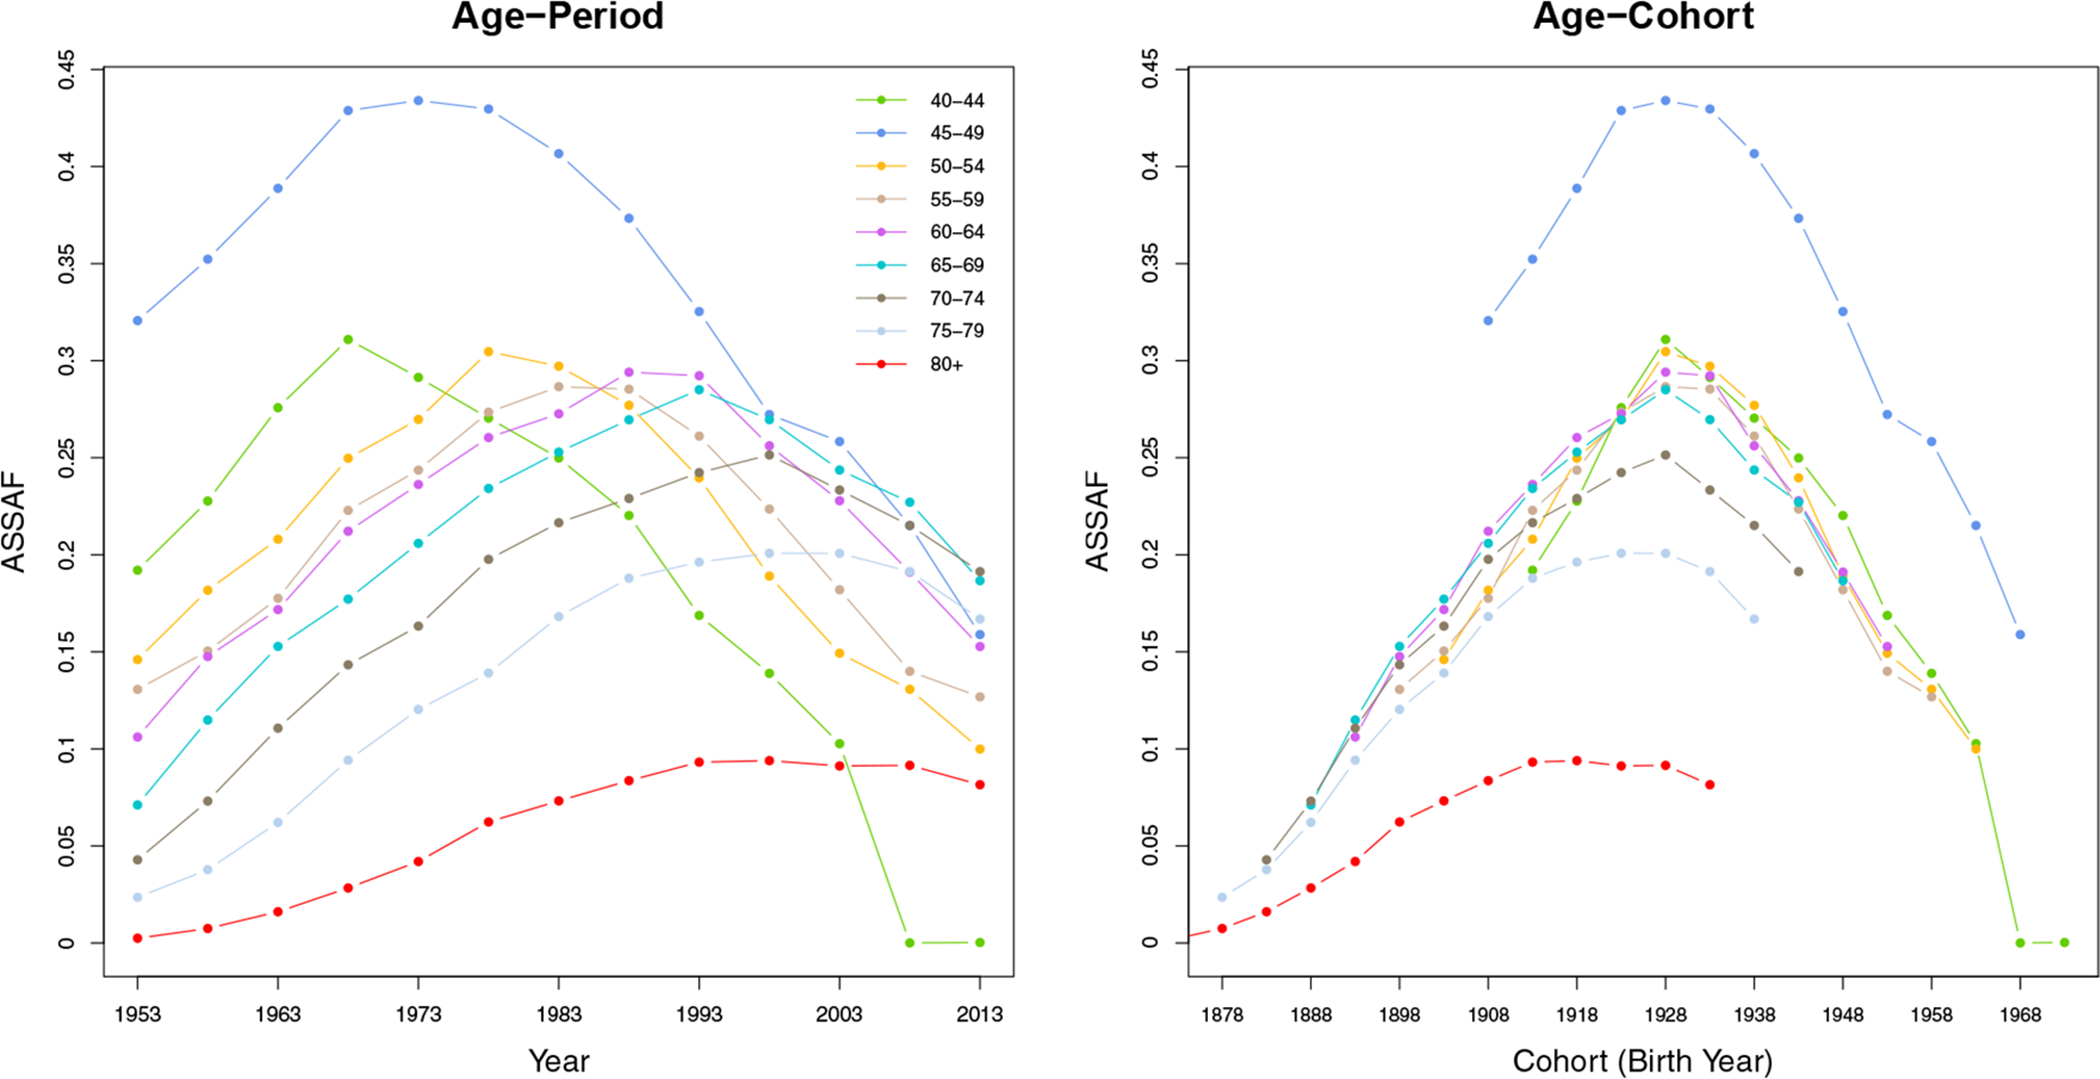
Figure 1:

Age-specific smoking attributable fractions (ASSAF) for the male population in the United States from 1950–2015. Left: Age-period plot. The horizontal axis is the year of observation and colors differentiate age groups. Right: Age-cohort plot. The horizontal axis is the year of birth for all cohorts, where the values for each age group are shown by a different color.
