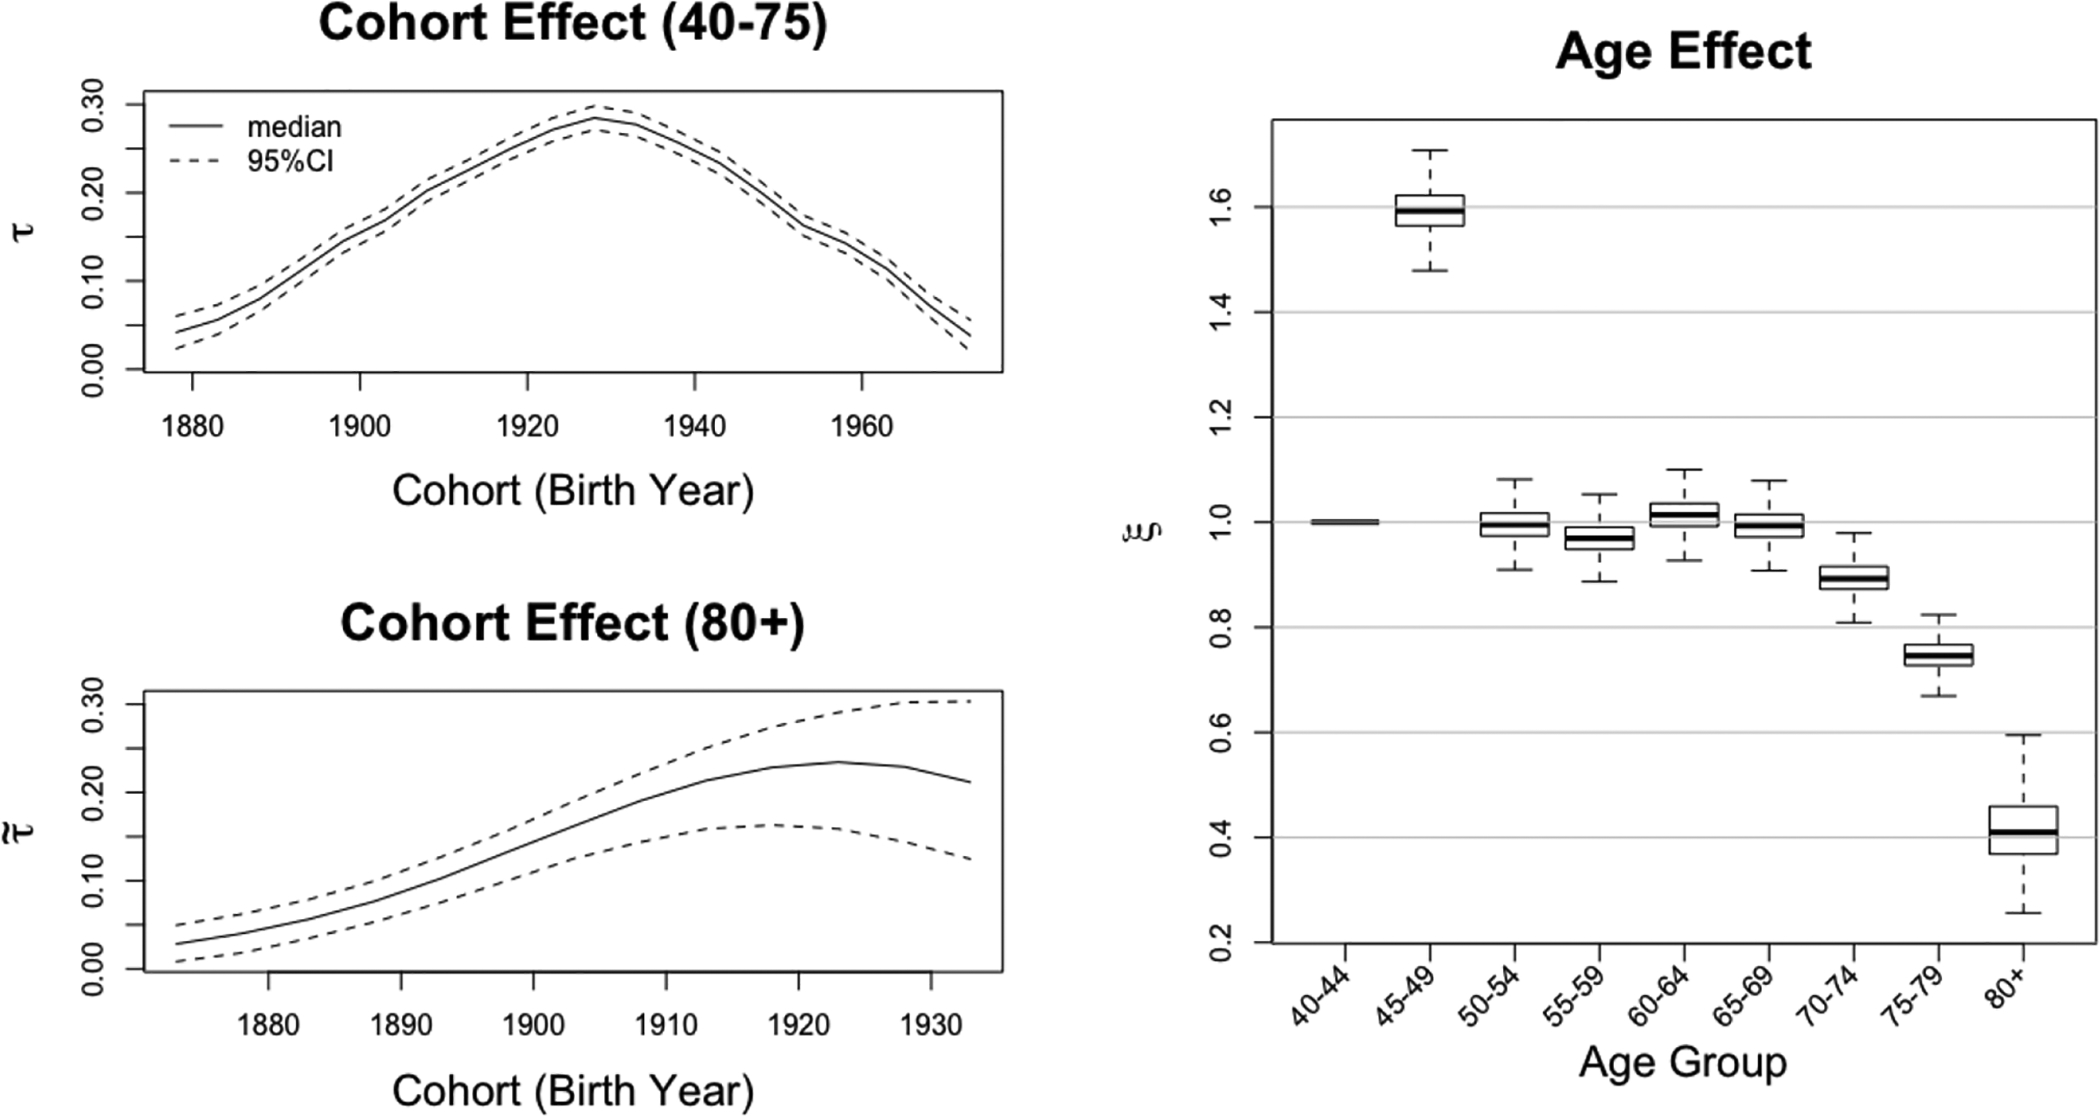
Figure 3:

Posterior distributions of cohort and age effects of United States male ASSAF. Top Left: posterior median and 95% credible intervals of the cohort effects τ for the 40–79 age groups. Bottom Left: posterior median and 95% credible intervals of the cohort effect for the 80+ age groups. Right: boxplot of posterior distribution of the age effect.
