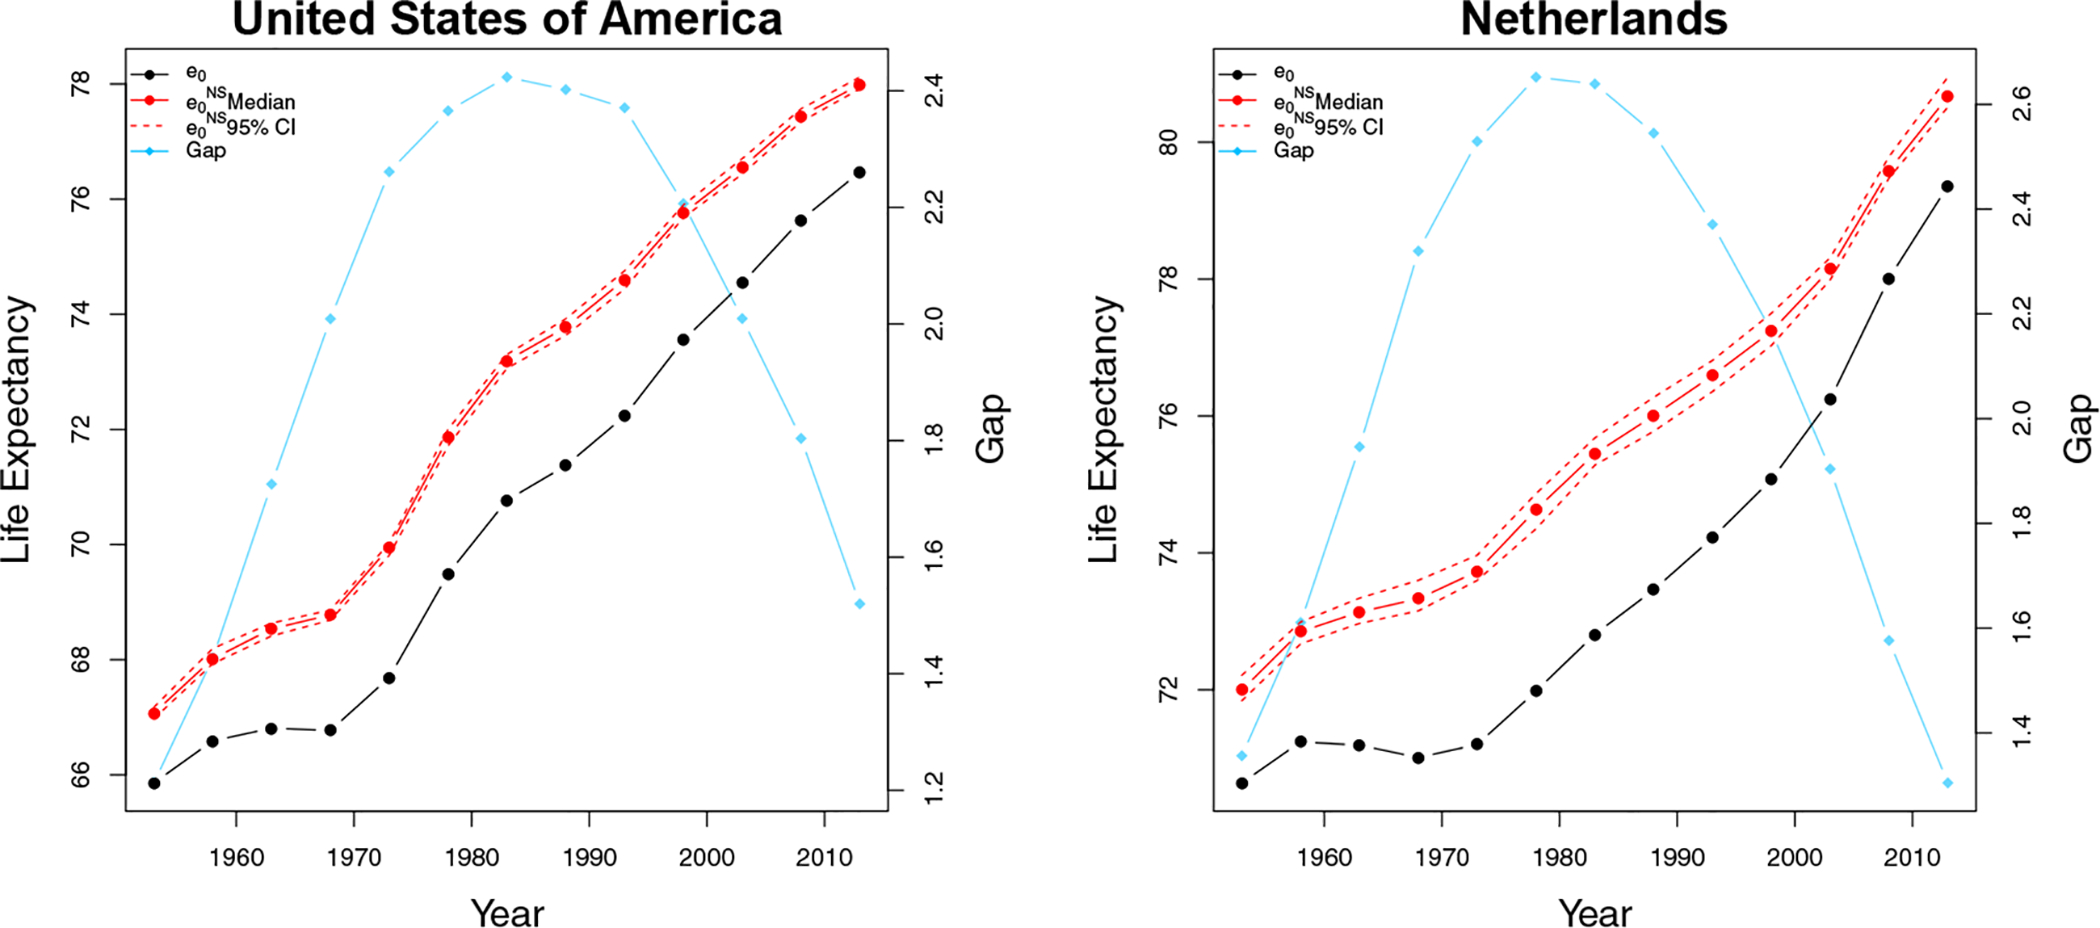
Figure 5:

Male life expectancy at birth, e0, and male non-smoking life expectancy at birth, , for the United States (left) and the Netherlands (right). The black line shows e0. The solid red line and the dashed red lines show the posterior median and the 95% credible interval of . The blue line represents the gap between e0 and .
